

Eclipse’s Shadow Felt on Southern Great Plains Instruments
Published: 29 August 2017
While the total solar eclipse of August 21, 2017, wowed spectators throughout the United States, instruments at the ARM Facility’s Southern Great Plains (SGP) atmospheric observatory recorded data connected to the rare event.
The first total solar eclipse to sweep across the United States in 99 years appeared as a partial eclipse over the SGP, starting at 11:36 a.m. CDT (Central Daylight Savings Time Zone) and ending at 2:33 p.m. The SGP observatory is located in north-central Oklahoma and south Kansas.
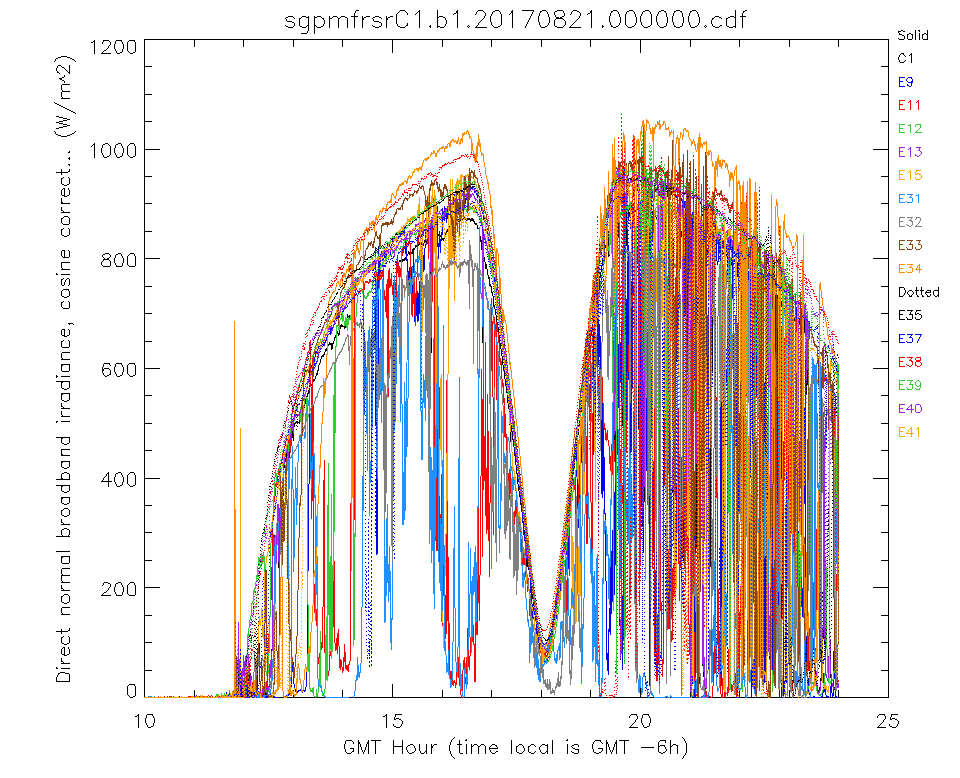
During its almost three-hour show, the eclipse made its mark on the SGP broadband radiometer station (BRS) and multifilter rotating shadowband radiometer (MFRSR) data records, among others.
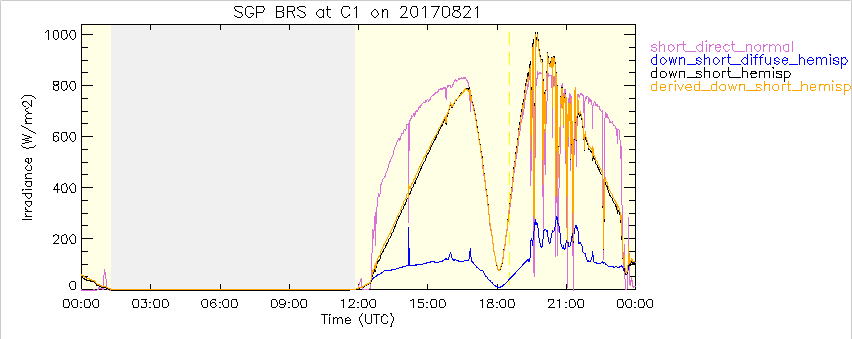
The BRS, which measures broadband solar and infrared radiation, and the MFRSRs—calculating solar direct normal broadband radiation—both showed large drops as the eclipse approached its peak time of 1:04 p.m. ARM Data Quality Office student analyst Bryan Sheridan was the first to see the eclipse effects on the BRS data. Check out the BRS plots from that day here.
For almost the full length of the eclipse, all SGP solar and infrared radiation station sites showed an eclipse signature for downwelling and upwelling components.
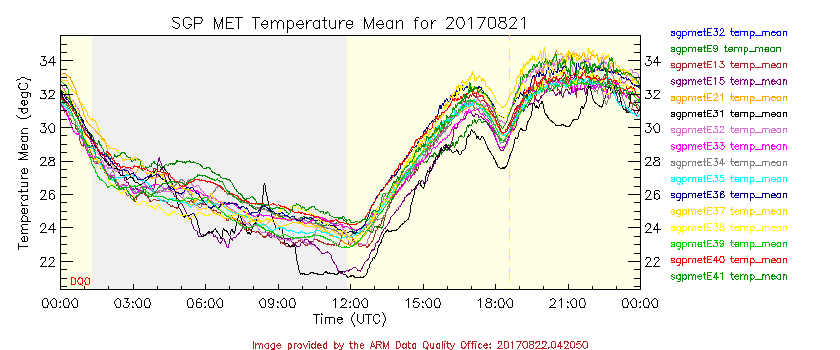
As the eclipse hit its maximum coverage of 89 percent over the SGP Central Facility near Lamont, Oklahoma, observers saw a 1- to 2-degree Celsius dip in temperature as measured by ARM surface meteorological stations around the observatory.
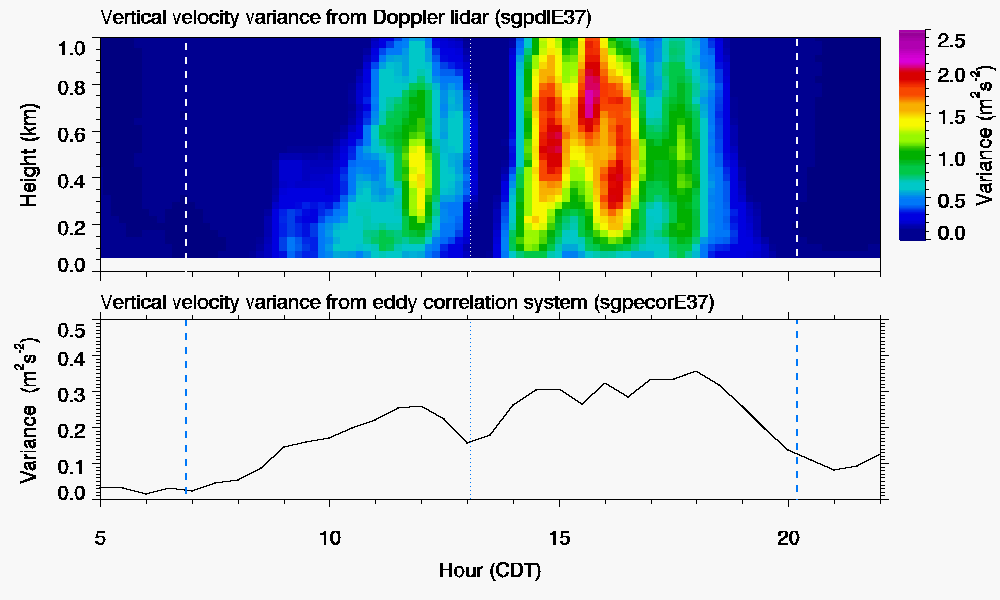
The eclipse had an effect on vertical velocity variance near the surface, according to eddy correlation data, but its influence on turbulence was more dramatic in the middle of the boundary layer.
“The Doppler lidar shows that turbulent motions nearly completely collapsed throughout the entire depth of the boundary layer as a result of the eclipse,” says Rob Newsom, ARM instrument mentor for Doppler and Raman lidars. “We note that the other SGP Doppler lidars (five total) show similar results.”
About 900 miles east of the SGP Central Facility, ARM Data Center staff from Oak Ridge National Laboratory were firmly in the path of totality.
“I got to watch it in my backyard, and I got to witness 100 percent totality,” says Rob Records, ARM Data Center Technical Lead. “It was one of the most amazing things I have ever seen.”
The next visible total solar eclipse in the United States will happen April 8, 2024. We can expect another round of intriguing measurements when that eclipse peaks around 90 percent over the SGP.
The ARM Climate Research Facility is a DOE Office of Science user facility. The ARM Facility is operated by nine DOE national laboratories.
Follow Us:


Keep up with the Atmospheric Observer
Updates on ARM news, events, and opportunities delivered to your inbox
ARM User Profile
ARM welcomes users from all institutions and nations. A free ARM user account is needed to access ARM data.


