

Thanks to an Air Campaign, a New View of Tropical Forest Emissions
Published: 23 May 2017
GoAmazon researchers grapple with the complexity of biogenic volatile organic compounds
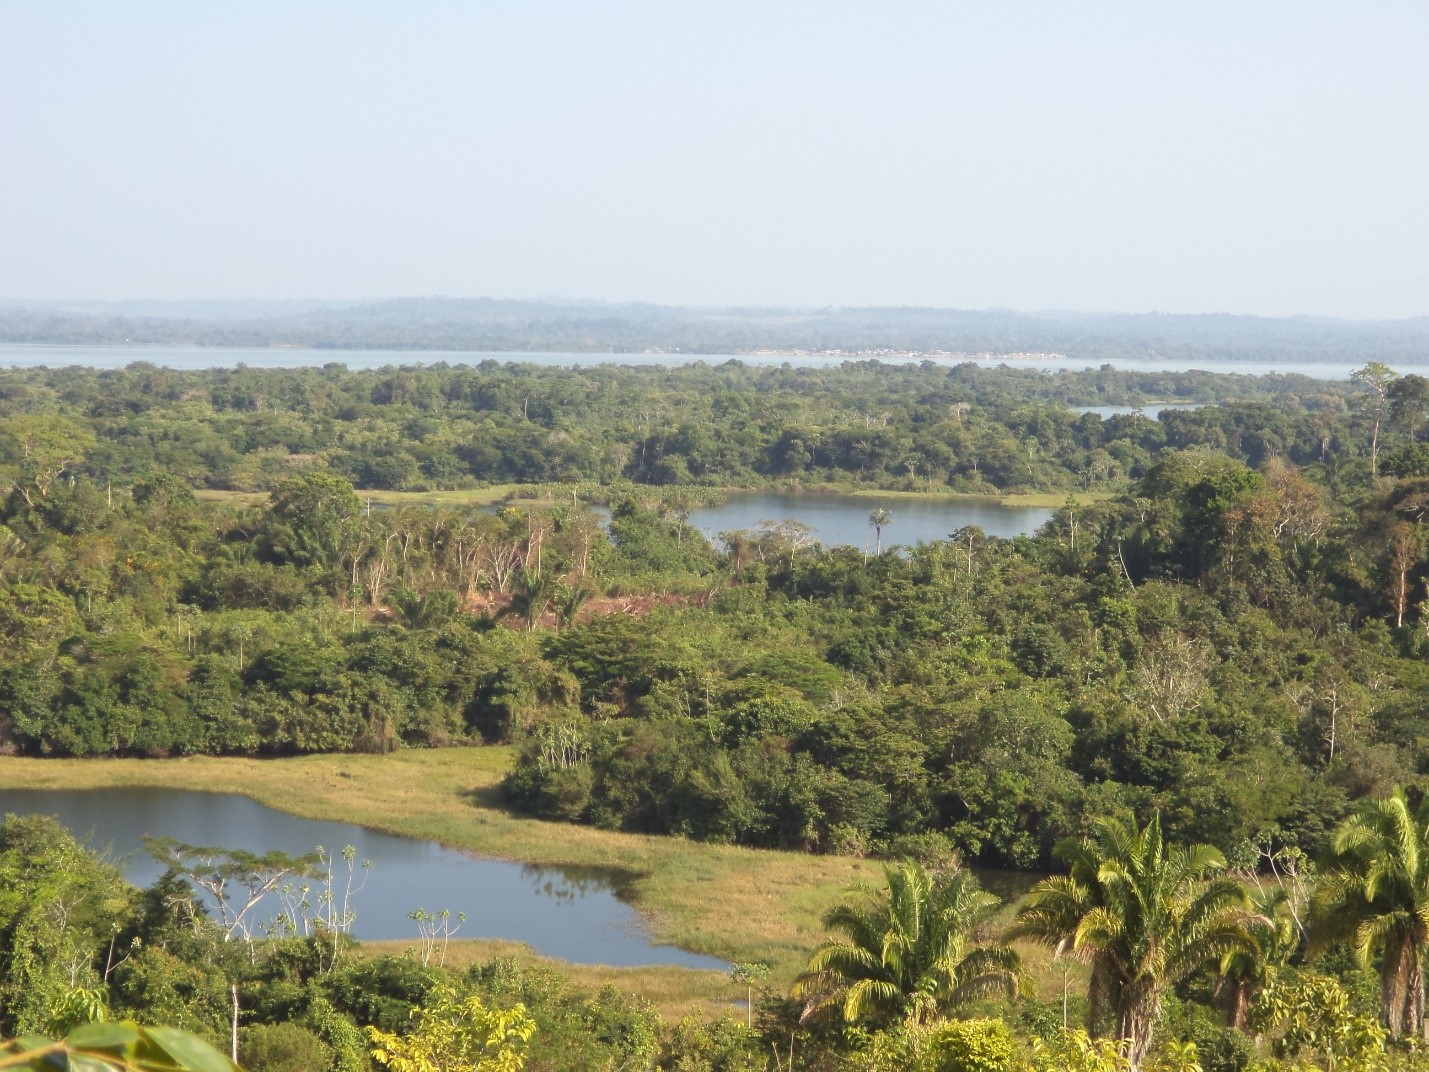
During the 2014-2015 Green Ocean Amazon (GoAmazon) campaign, scientists studied the atmosphere above and around Manaus in central Brazil during both the wet and dry seasons. This unique research landscape allowed them to investigate a polluted urban environment set in the midst of the near pristine vastness of Amazon rainforest that spans 1,500 kilometers in any direction.
In research bursts of one month each, scientists from Brazil, the United States, and several European countries measured three atmospheric worlds: that of the urban plume; the hybrid world created by the clash of urban and pristine air; and that of the forest alone, as it was—perhaps—eons ago.

It was the forest-only view that intrigued Dasa Gu and Alex Guenther of the University of California, Irvine, along with Zhiyuan Hu of Pacific Northwest National Laboratory (PNNL) and China’s Lanzhou University. In a recent Nature Communications paper, they and 19 co-authors used GoAmazon data to report some startling conclusions about isoprene. That’s the non-methane biogenic volatile organic compound (BVOC) from plant matter that influences atmospheric oxidants and aerosols.
Isoprene emissions, the paper concluded, could be as much as three times higher than reported by satellite observations (the usual method for getting such data). The authors also concluded that a previously unexamined “elevational gradient” in the Amazonian forest may substantially explain the variability of isoprene emissions in tropical forests.
“Most isoprene in the world is from the Amazon rainforest, but unfortunately, previous data were very limited,” said lead author Gu, a postdoctoral researcher. Starting this month (May), he will divide his time between Irvine and PNNL, where he had worked before.
Supplementing Satellite Data
During GoAmazon, researchers collected data from towers set in the forest canopy and from nine instrumented land sites. One of those included a mobile site provided by the U.S. Department of Energy’s Atmospheric Radiation Measurement (ARM) Climate Research Facility. Importantly, ARM also provided its Gulfstream-159 (G-1) research aircraft for both of the campaign’s weather phases.
Satellite data on isoprene were available, but their resolution was not very high. Moreover, measurements of BVOCs from the towers were geographically limited data. That made airborne data, said Gu, “the most important thing” for getting an accurate picture of isoprene levels.
The G-1 was so significant because of “the nice regional scale it covered,” pulling in data from a radius of 2 kilometers, said Guenther. He’s a veteran modeler and investigator of biogenic emissions, who has led more than 40 field studies on six continents. Satellite data are broad, but their accuracy remains controversial, and tower data could not be easily related to data from Earth orbits because of the large differences in scale.
Aboard the G-1, PNNL atmospheric scientist (and co-author) John Shilling took in some of the data the Gu-Guenther-Hu paper required. Seen from 1,500 feet, he said, the Amazon River was astonishing and lives its reputation as a “river sea.”
At that modest altitude also, scientists get shaken like beans in a gourd. “It was hot, humid, and bumpy—physically demanding,” said Shilling of his more than 20 flights, which each lasted about three hours. The dramatic view and fine data, he added, were more than worth a little discomfort.
For the paper, the most important instrument Shilling watched over was ARM’s Proton Transfer Reaction Mass Spectrometer (PTR-MS), which measures BVOCs as well as human-caused emissions. Air is drawn through a forward-facing gas-phase tube outside the G-1, mounted in a window blank. The PTR-MS then measures different species of BVOCs, gathers wind speed data, and can later filter out data more useful for measuring the urban plume, such as ozone and nitrous oxide.
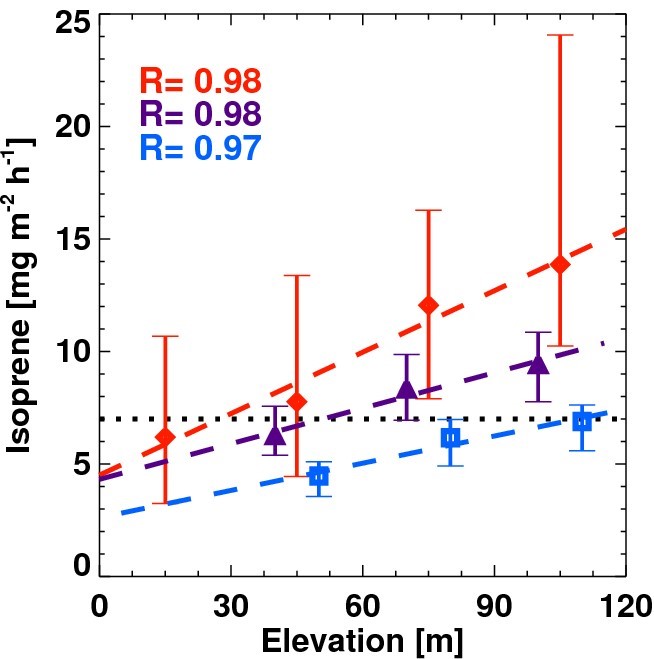
The airborne part of the campaign supplied isoprene data of unprecedented resolution, but also revealed that as the elevation of the terrain got higher, isoprene emissions got higher too. That “quite interesting” phenomenon could be explained by a variance in tree species, said Gu, or it could indicate that trees at higher elevations, with less water, exhibit more stress and release more isoprene for that reason.
The elevational gradient could also be a reflection of differing soil types, said Guenther, or—more likely—the difference in tree species between low and higher elevations. There are other knowledge gaps still to be addressed, he added, including the fate of isoprene emissions during daytime compared to night.
Toward Improved Models
The PTR-MS was also important to the paper’s wavelet analysis, a statistical technique for capturing points of data—like isoprene in the atmosphere—that oscillate. “You need statistics” to interpret the data, said Guenther, and for the data “you need the instrument on the G-1.” It took isoprene measurements several times a second, then calculated a “moving average” of BVOCs every minute.
In turn, the spatiotemporal distribution of isoprene had to be simulated in order to reliably inform models. To estimate fluxes of BVOCs like isoprene, the researchers used the Model of Emissions of Gases and Aerosols from Nature (MEGAN) developed by Guenther; it factors in land cover and other environmental conditions. MEGAN “is basically how we integrate all our data and get it into global models,” he said.
It may turn out that such forest emissions are very different in other places across the globe, and even in other regions of Amazonia. “We can’t just extrapolate,” said Guenther, so more work is ahead.
Gu said other papers were under way using the same data set, including one on the forest atmosphere’s oxidation capacity—that is, how readily trace gases like isoprene are scrubbed from the air.
During GoAmazon, Guenther spent most of his time at T-3, one of nine instrumented land sites. All of the data collected are good news to modelers and other atmospheric scientists trying to put forest emissions in perspective. They recorded forest emissions, gathering up, he said, “the most comprehensive data set we have.”
Find the Nature Communications paper online.
The ARM Climate Research Facility is a DOE Office of Science user facility. The ARM Facility is operated by nine DOE national laboratories.
Follow Us:


Keep up with the Atmospheric Observer
Updates on ARM news, events, and opportunities delivered to your inbox
ARM User Profile
ARM welcomes users from all institutions and nations. A free ARM user account is needed to access ARM data.


