

TRACER Cell Tracking Data Shed Light on Convective Evolution
Published: 28 September 2023
One challenge in analyzing convective cell properties is trying to observe the quick evolution of individual convective cells, which might not be captured by conventional radar volume scans that take about 5 to 7 minutes.
Aiming to enhance understanding of the links between convective cloud kinematic and microphysical processes as well as cloud life cycles, the Atmospheric Radiation Measurement (ARM) user facility deployed its second-generation C-Band Scanning ARM Precipitation Radar (CSAPR2) to the Houston, Texas, area to track individual convective cells less than every 2 minutes during the TRacking Aerosol Convection interactions ExpeRiment (TRACER) in summer 2022. These cell tracking data, funded by the U.S. Department of Energy’s Atmospheric System Research (ASR) program, are now available from ARM as a principal investigator product.
A cell tracking framework called Multisensor Agile Adaptive Sampling (Kollias et al. 2020) guided the CSAPR2 scans. This framework helped scientists capture fast-evolving radar parameters associated with dynamical and microphysical cloud processes. ARM funded the development of the cell tracking software used for TRACER.
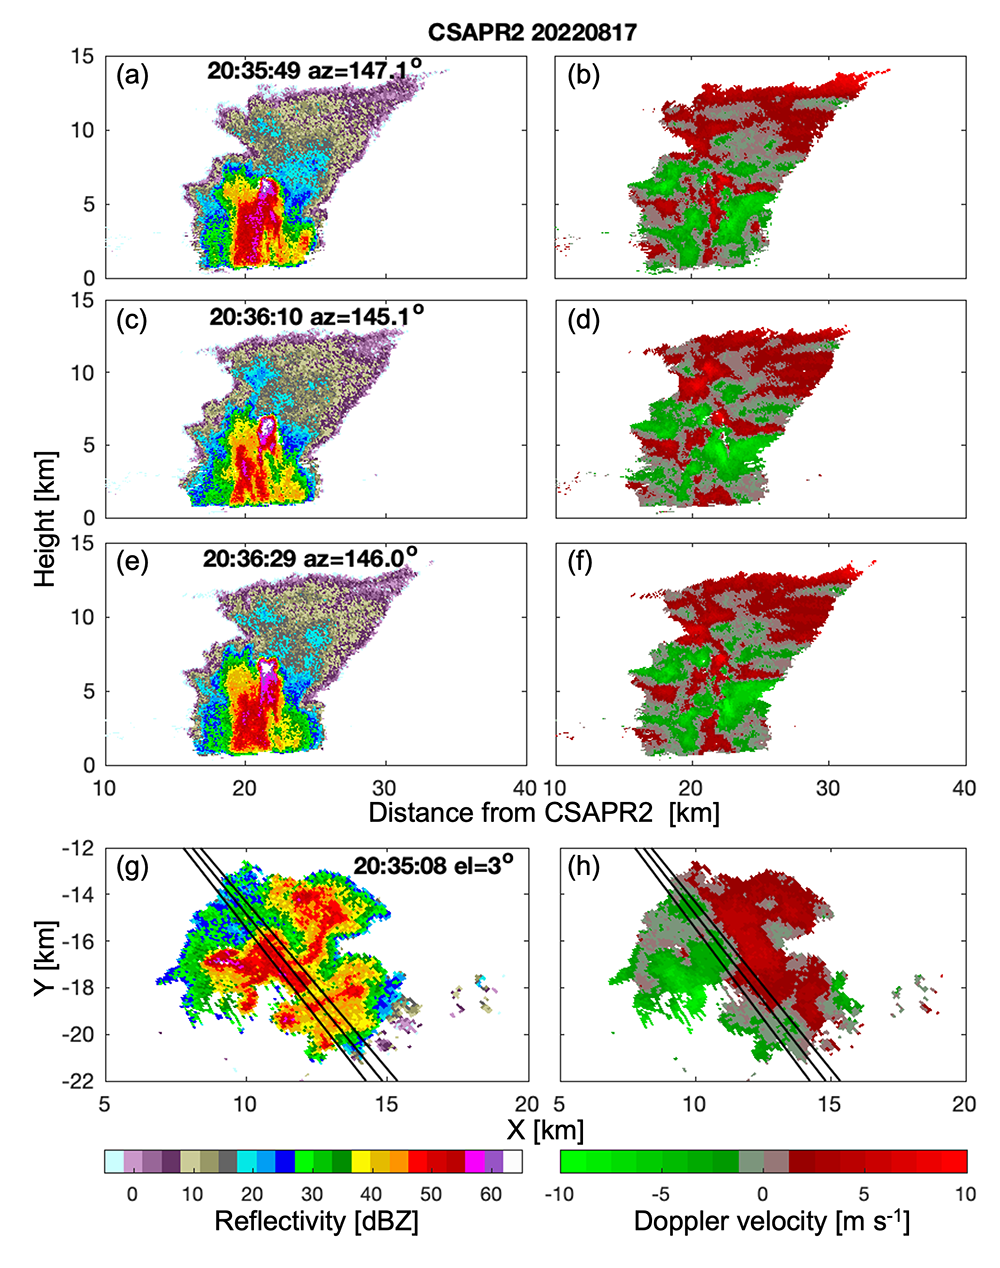
To observe rapid changes in convective cell properties, the CSAPR2 performed sets of cell tracking scans in Pearland, Texas, during the TRACER field campaign’s summertime intensive operational period from June through September 2022.
The CSAPR2 performed sector plan position indicator (PPI) scans at three elevation angles (low, middle, and high), followed by four to six range-height indicator (RHI) scans based on different criteria (e.g., maximum reflectivity, maximum differential reflectivity, cell centroid) targeting single convective cells. Each set of scans was achieved within 2 minutes.
The following processed CSAPR2 variables are provided in CfRadial format:
- noise-masked reflectivity and differential reflectivity corrected for rain attenuation and systematic biases
- noise-masked dealiased radial velocity
- specific differential phase
- locations of target cells (latitude, longitude, distance)
- radar-echo classification.
Each set of the three sector PPI scans and four to six RHI scans is bundled into a single file.

Scientists can analyze rapid changes in radar observables that represent dynamical and microphysical evolutions of convective cores. The data set includes 24,423 scan bundles, most of which were collected in the afternoon, and more than 1,000 cells tracked during the summer. The majority of tracked cells had lifetimes lasting less than 60 minutes.
This data set is expected to bolster the volumetric analysis of the operational radar measurements and provide new insights into cell evolution.
More information on the data set is available on the principal investigator product web page.
Access the data in the ARM Data Center. (To download the data, create an ARM account.)
For questions or to report data problems, please contact Mariko Oue.
Data can be referenced as doi:10.5439/1969992.
Reference: Kollias P, E Luke, M Oue, and K Lamer. 2020. “Agile adaptive radar sampling of fast‐evolving atmospheric phenomena guided by satellite imagery and surface cameras.” Geophysical Research Letters, 47(14), e2020GL088440, https://doi.org/10.1029/2020GL088440
Follow Us:


Keep up with the Atmospheric Observer
Updates on ARM news, events, and opportunities delivered to your inbox
ARM User Profile
ARM welcomes users from all institutions and nations. A free ARM user account is needed to access ARM data.


