

A New Anatomy of Thunderstorms
Published: 23 July 2019
A data-rich field campaign in Argentina will answer some mysteries of how deep convective systems begin, grow, and organize
On the afternoon of May 22, 2019, Vagner Castro was busy in his outdoor office: a level, grassy stretch of land near Villa Yacanto, Argentina, a village of a thousand residents high up in the Sierras de Córdoba mountain range. He and his crew were packing the last of the gear used at the main site of a spectacular atmospheric science research event.
The Cloud, Aerosol, and Complex Terrain Interactions (CACTI) field campaign had officially ended three weeks before. (It ran from October 2018 through April 2019.) But someone had to pack up afterwards.
CACTI explored the life cycles of large convective storms in the region, which is said to be the birthplace of the biggest thunderstorms in the world.
The campaign unfolded in unprecedented detail, and over a longer period—seven months—than any such previous study with such extensive measurements.
Nearly 200 scientists and students from seven countries took part. Many are now busy getting science out of CACTI’s terabytes of data.
A Firsthand Look at Booming Storms
“Success is if you have data that answer questions.”
Adam Varble, CACTI principal investigator
Severe thunderstorms—among the atmosphere’s most destructive phenomena—can produce high winds, hundreds of lightning strikes per minute, raging floods, and damage to crops and roadways. Such storms generate hail that, if heavy enough, can plummet to the ground at 60 mph.
CACTI was supported by the U.S. Department of Energy’s Atmospheric Radiation Measurement (ARM) user facility.
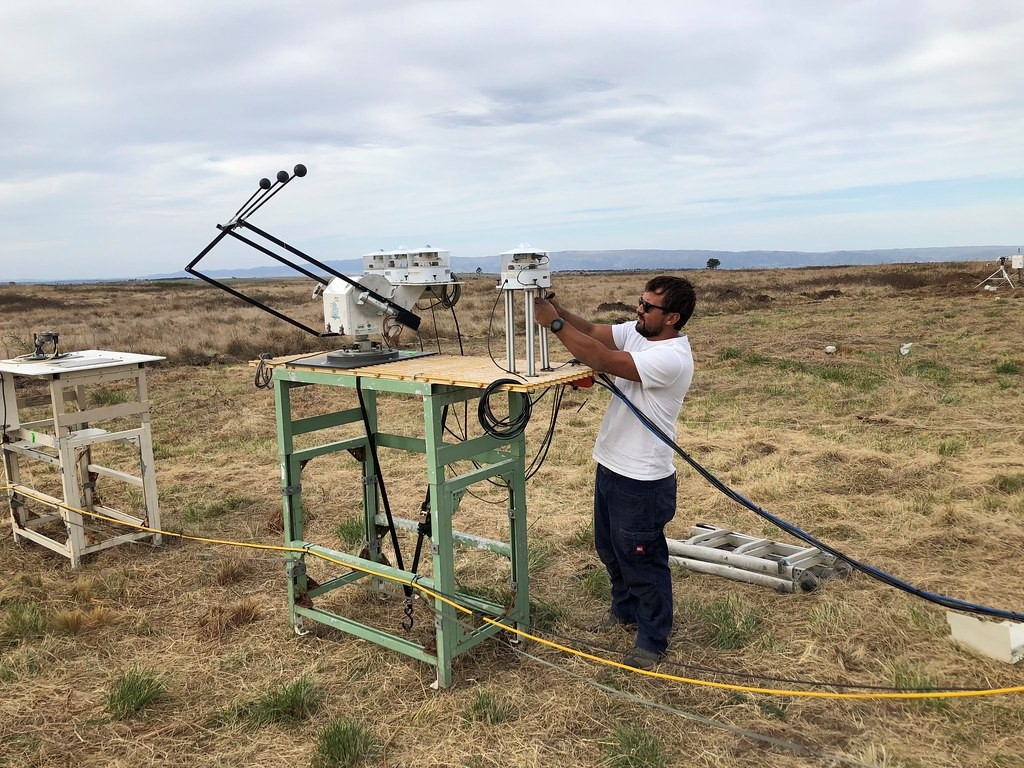
Castro is lead technician for the first ARM Mobile Facility (AMF1), which served as the primary CACTI observing facility. The site was about 20 kilometers (12 miles) east of the primary north/south-oriented ridge top in the mountain range.
At an elevation of 1,140 meters (about 3,740 feet), the main CACTI observatory had clear views in every direction and was ideal for observing the development of the big storms that often formed along, and east of, the high mountain ridge lines. Commonly, such storms passed right overhead.
“We can see conditions all around,” says CACTI principal investigator Adam Varble, an atmospheric analyst and modeler at Pacific Northwest National Laboratory in Washington state. “CACTI is giving us a holistic view of the components that go into deep convection.”
The field campaign’s data seem promising at this stage, he says: voluminous, unique, and from an unusually long time period for a campaign targeting deep convective systems.
Still, “the success of any campaign is the science that comes out of it,” says Varble. “You really don’t know that for three or four years. Success is if you have data that answer questions.”
A New Wealth
The CACTI mission was to close knowledge gaps about the origins of deep convective storms—how they start, why some grow so big, and how they fade once their power is sapped.
Seven days a week, Castro and his team checked and maintained the 50-plus instruments deployed with AMF1. The data gathered included measurements of the properties of clouds fed by moisture coming from the north as they interacted with higher-altitude airflows from the west.
Other data came from:
- radiosondes at multiple sites (Castro’s team alone launched four to five a day)
- ARM’s Gulfstream-159 (G-1) research aircraft (on its last mission)
- a companion campaign, largely funded by the National Science Foundation (NSF)
- the GOES-16 satellite supported by the National Oceanic and Atmospheric Administration (NOAA) and NASA.
In all, says Varble, CACTI’s seven data-rich months represent a new wealth of measurements on cloud dynamics and microphysics, ambient thermodynamic and kinematic and surface conditions, and properties of aerosols (tiny particles in the air).
Since the campaign ended, Varble and others are coping with a storm of data, happily organizing the measurements ahead of a November 2019 data workshop in Buenos Aires, Argentina.
Out of 212 days of CACTI measurements, he calculates, 183 had a variety of daytime clouds over the AMF1 site and 96 days had surface rainfall.
Most promising of all, he says, is that fully 80 days of deep convective activity were observed overhead.
High-Impact Weather
CACTI ran concurrently with RELAMPAGO, a U.S.-Argentine-Brazilian campaign funded largely by NSF. In Spanish, the word means “flash of lightning.” As an acronym, it aptly stands for Remote Sensing of Electrification, Lightning, and Mesoscale/Microscale Processes with Adaptive Ground Observations.
RELAMPAGO’s researchers conferred on deployments, forecasting, and the design of experiments and missions. They set up fixed instrument sites separate from AMF1 and in the same mountainous region deployed a fleet of storm-chasing mobile radars mounted on trucks. They also tracked large hail, strong winds, and heavy precipitation.
The same researchers also worked at a breakneck pace during a nearly seven-week CACTI-RELAMPAGO intensive operational period from November 1 to mid-December 2018.
During that time, researchers conducted 19 missions on days with forecasted conditions that were promising.
“We are currently tearing into the mountain of data we collected—and it looks fantastic,” says Stephen Nesbitt of the University of Illinois, who was principal U.S. investigator for RELAMPAGO and one of 17 U.S. and Argentine CACTI co-investigators.
“We observed a huge number of cases where shallow cumulus clouds remained shallow,” he says, “where shallow convection became deep, and (where) convection grew upscale into mesoscale convective systems.”
Days and Days of Data
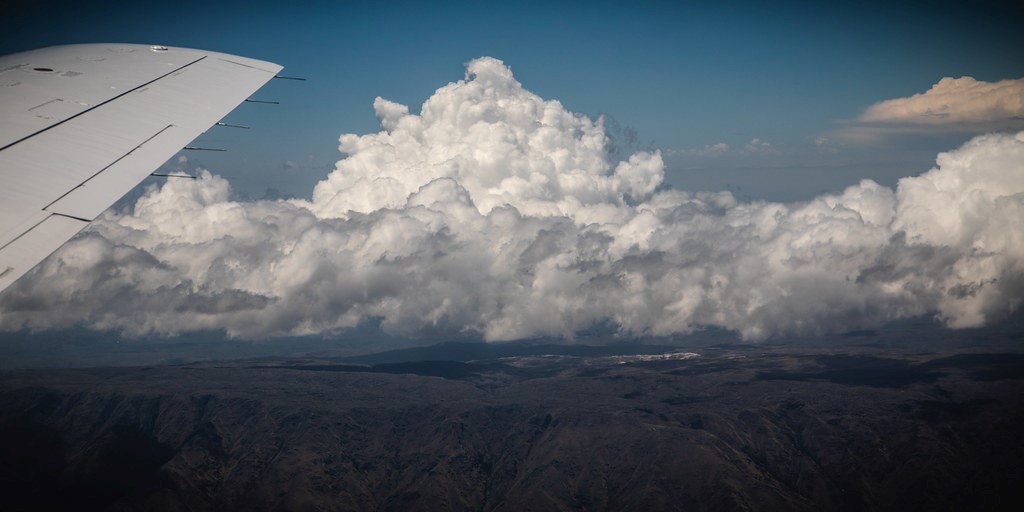
For CACTI, ARM’s G-1 aircraft flew 22 research flights at programmed altitudes and patterns through the surrounding evolving cumulus clouds. Its hangar was at Las Higueras Airport in Rio Cuarto, Argentina, two hours by car from the AMF1 site.
Airborne instruments drew in measurements on in-cloud dynamics, microphysics, aerosols, and environmental variables around clouds near the site.
With such data over so many cloudy and rainy days, CACTI produced an unprecedented number of detailed cases to study in the coming years.
All this “buys you better coverage of all the environmental conditions clouds interact with,” says Varble. “There are a lot of things that impact these storms.”
New Scans
The measurement strategy for CACTI was broad, says Varble, “but radars were the key instruments here.”
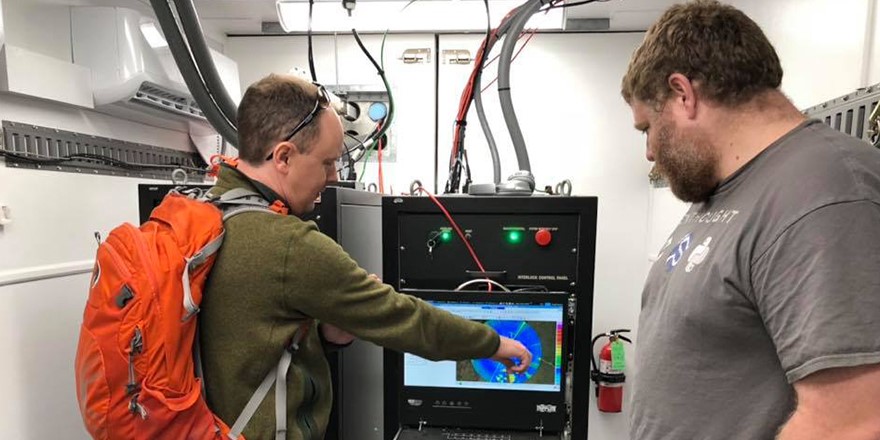
CACTI involved an ARM radar milestone: the deployment of the newest C-Band Scanning ARM Precipitation Radar (CSAPR2).
With a new approach to hemispheric scans, the CSAPR2 platform delivered three-dimensional images showing the complex structure of evolving convective systems. The visualized results look like a series of vertical atmospheric slices.
“What we’ve seen from these so far is really beautiful,” says Varble. “You get this tremendous vertical detail for storms, (including some) really small-scale features.”
Combine those scans with Ka-band radar measurements of the spatial structure of the clouds and rapid-scan satellite retrievals from NOAA, and there is hope for a one-of-a-kind radar data set on convective clouds.
The hope is to assemble a database of all the individual storms observed. That would be coordinated with a database capturing all the environmental conditions around storm cells, from soil moisture and surface thermodynamic fluxes to meteorological and aerosol conditions in the boundary layer and free troposphere.
“With so many tracked convective systems, you can isolate all of the different environmental conditions,” says Varble. “You can see what controls the life cycle of these deep convective clouds.”
Follow Us:


Keep up with the Atmospheric Observer
Updates on ARM news, events, and opportunities delivered to your inbox
ARM User Profile
ARM welcomes users from all institutions and nations. A free ARM user account is needed to access ARM data.


