

Annual Scientific Meetings Give Wide View of CACTI Research
Published: 16 February 2021
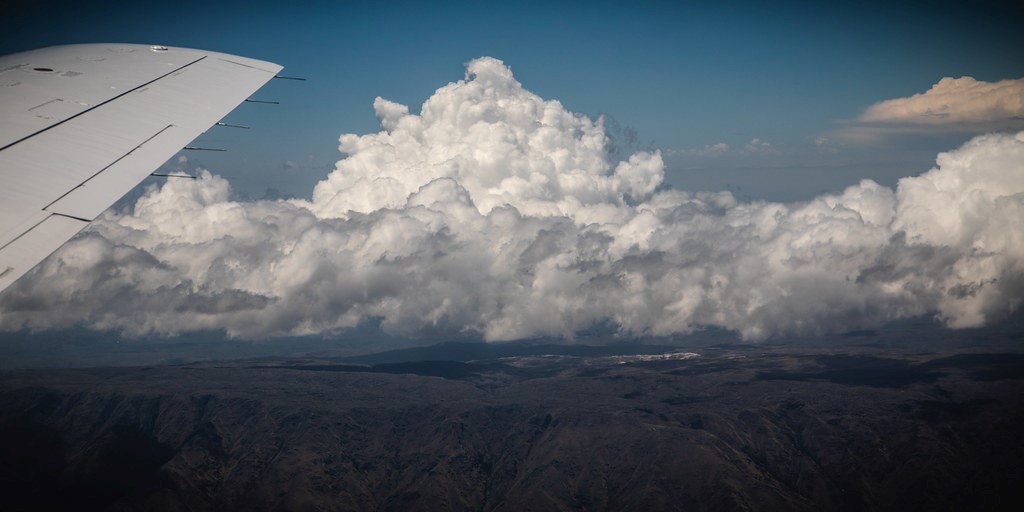
ARM campaign looking at convective cloud life cycle took place in the mountains of Argentina
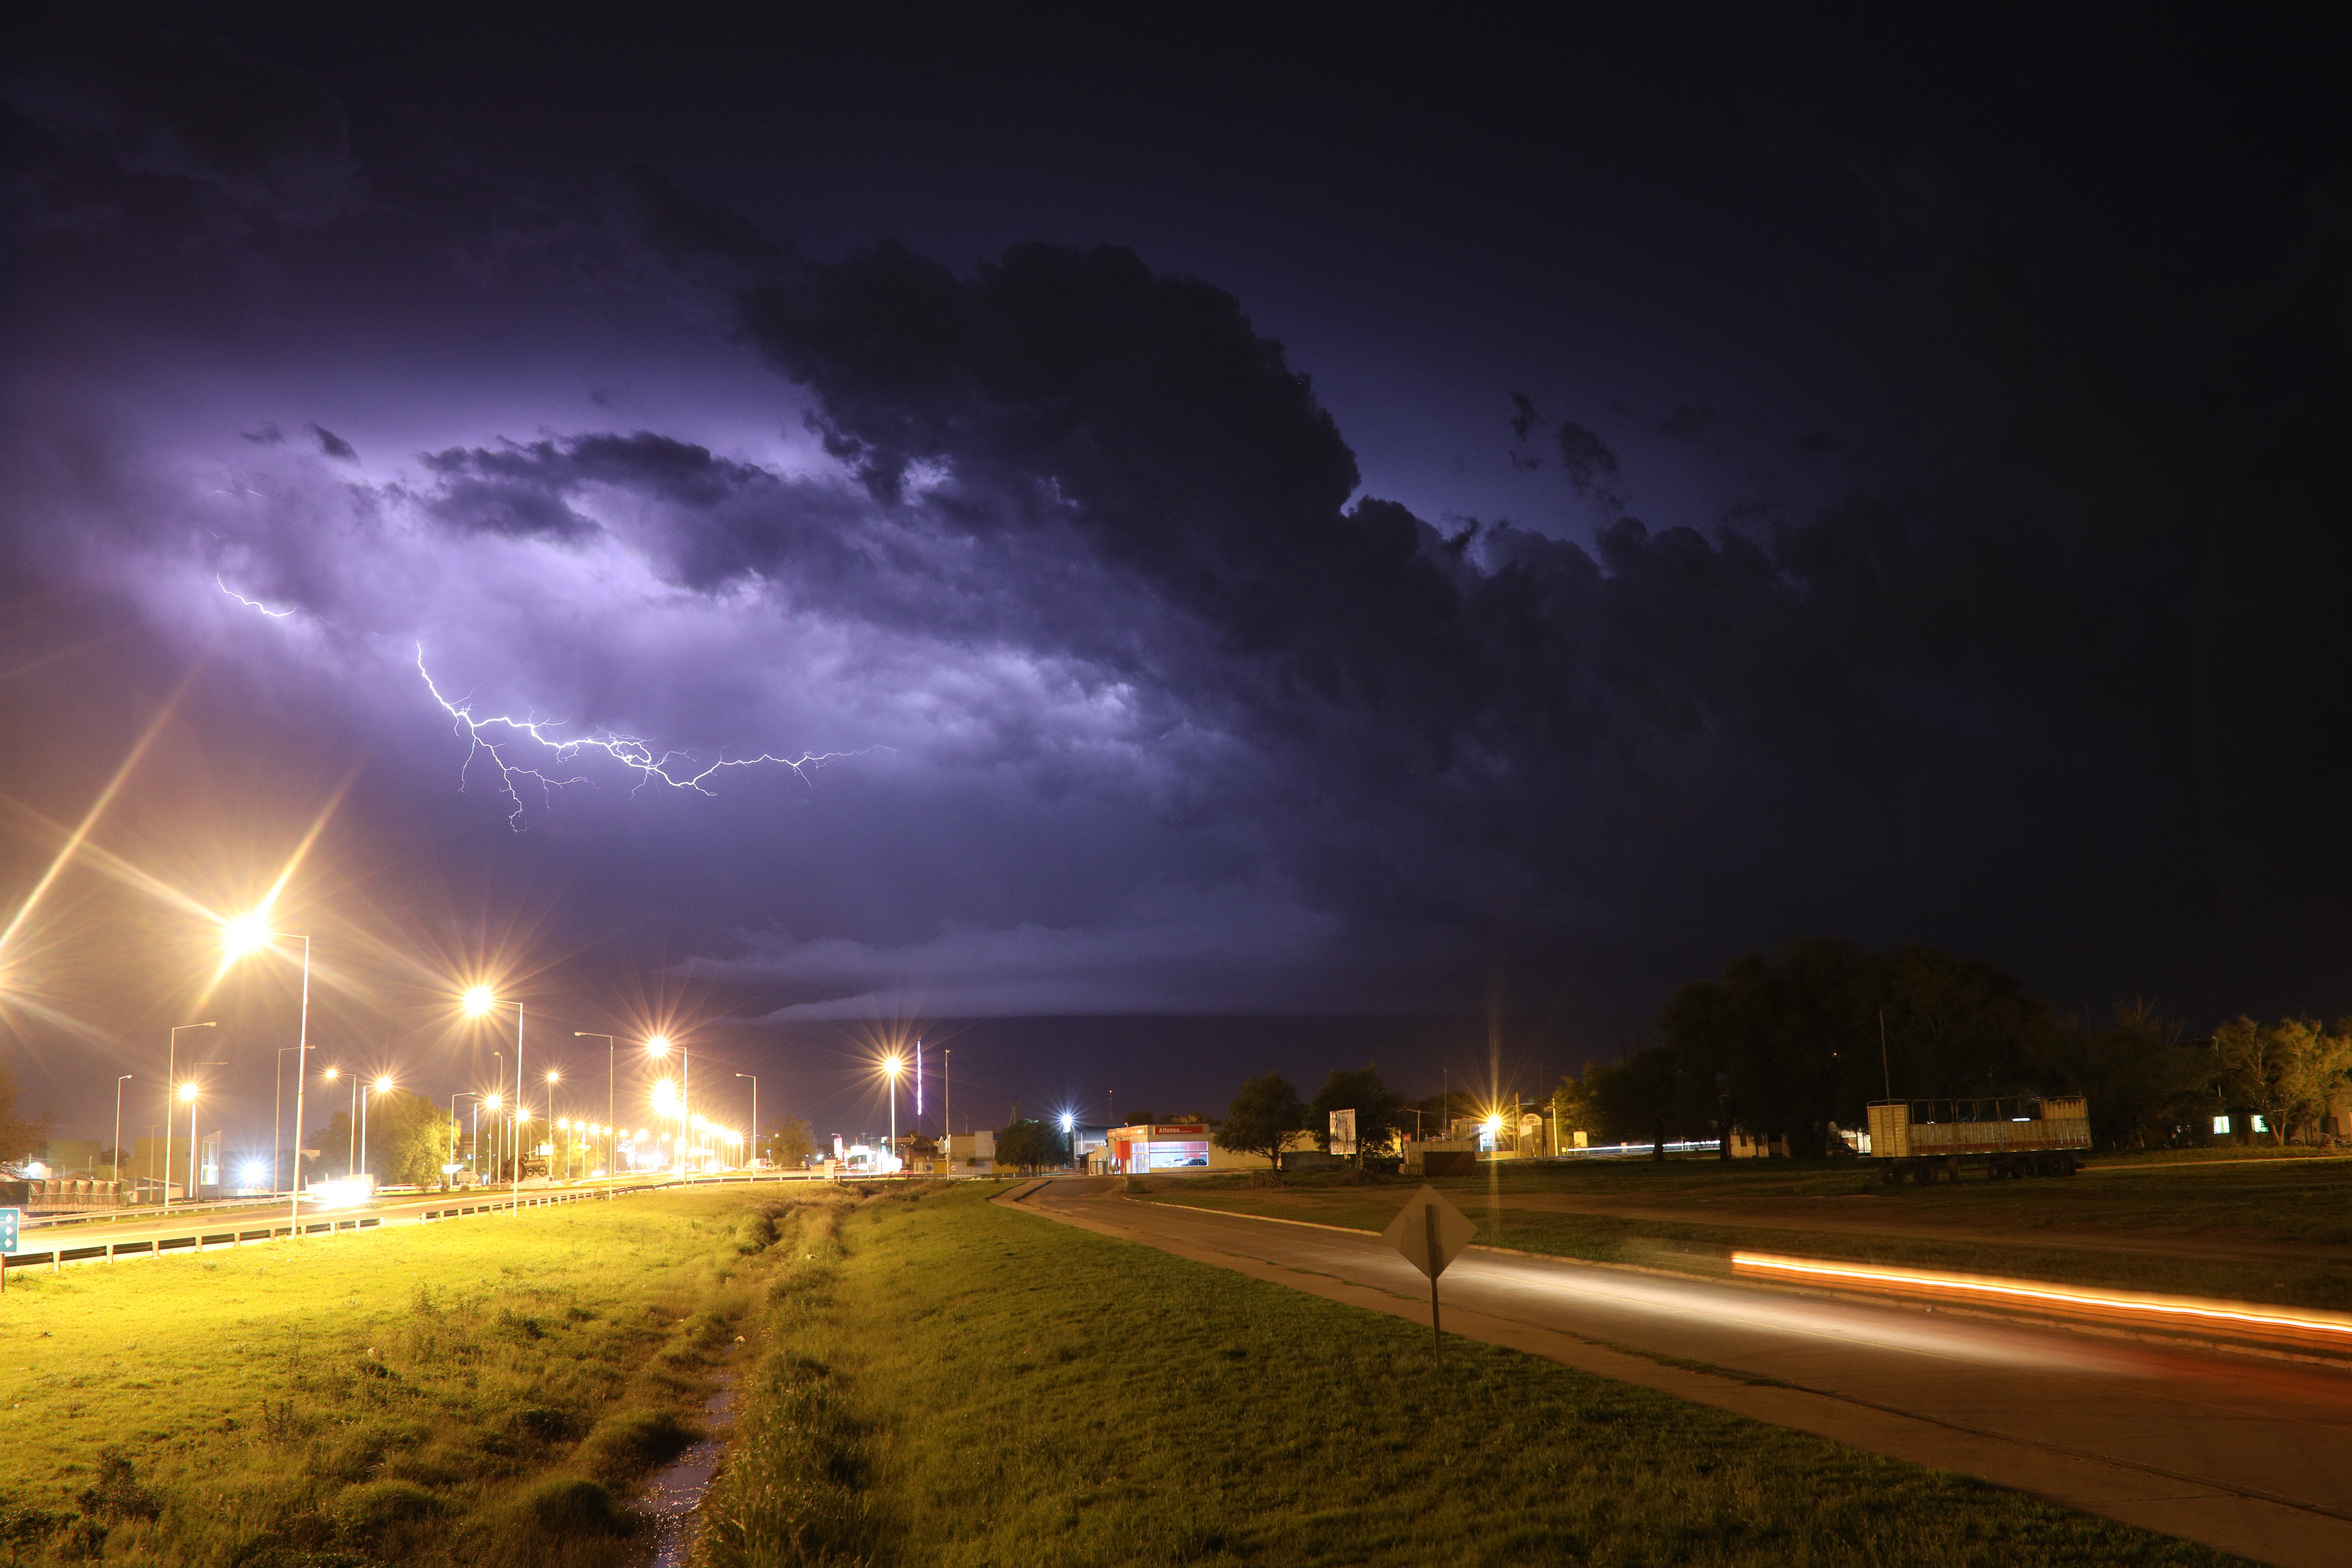
Data collected by the Atmospheric Radiation Measurement (ARM) user facility are providing clues about how clouds in central Argentina grow into notoriously large and long-lived thunderstorms.
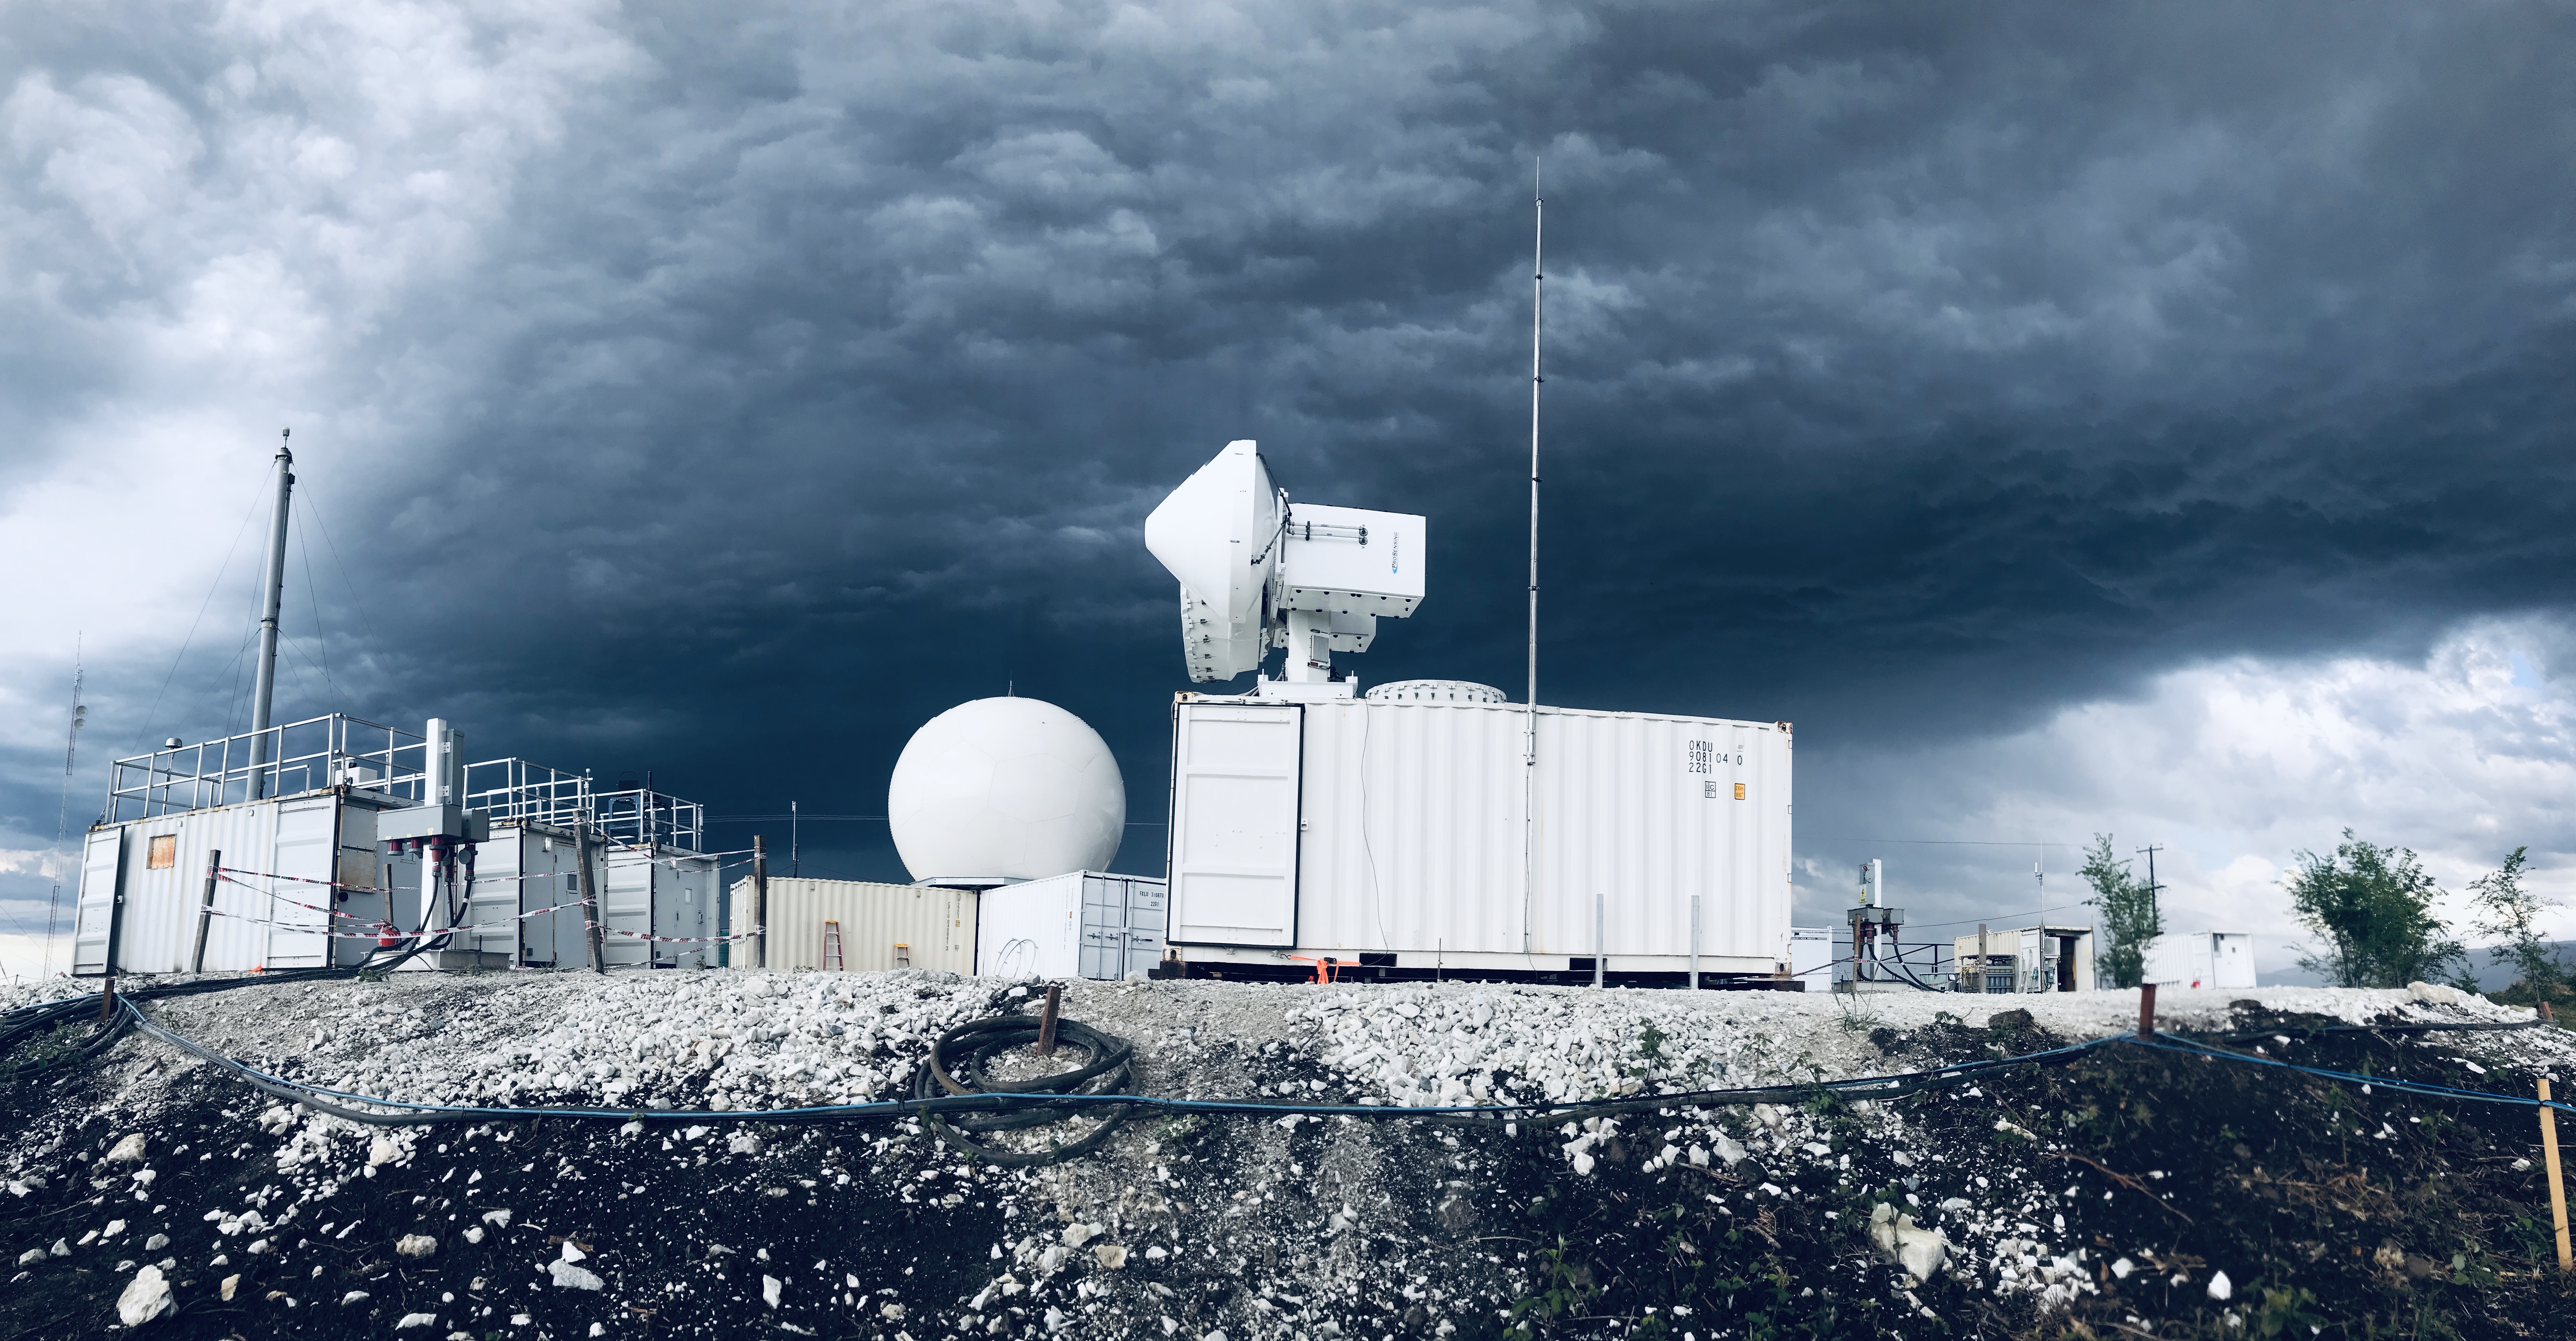
ARM’s Cloud, Aerosol, and Complex Terrain Interactions (CACTI) field campaign took place from October 2018 to April 2019 in the Sierras de Córdoba mountain range. CACTI used an ARM Mobile Facility (AMF) and—for a seven-week intensive operational period in late 2018—ARM’s now-retired Gulfstream-159 (G-1) research aircraft. Data from the campaign are freely available in ARM Data Discovery.
Scientists are using CACTI data to study shallow clouds and how they deepen and evolve into the thunderstorms responsible for rattling buildings—and bones—throughout the region. During the virtual 2020 American Geophysical Union (AGU) Fall Meeting and 2021 American Meteorological Society (AMS) Annual Meeting, researchers presented some of what they have done and learned so far.
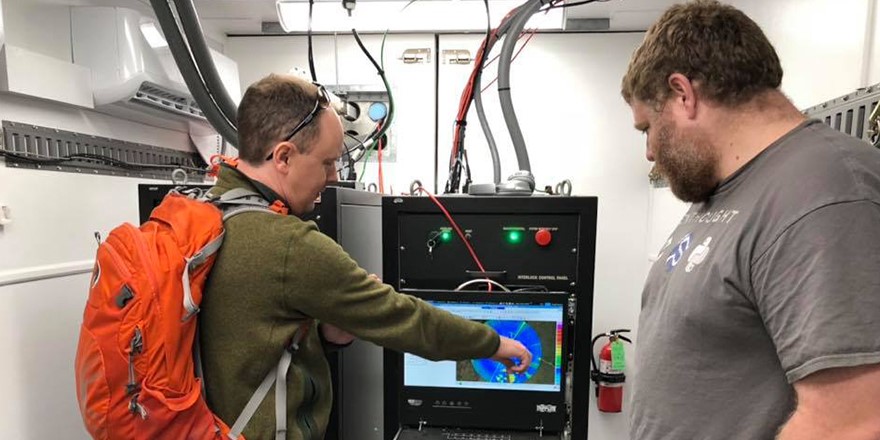
Much of the current work lies in filling in a database chronicling almost 7,000 convective cells tracked during CACTI. Many of the pieces are coming from the second-generation C-Band Scanning ARM Precipitation Radar (CSAPR2), deployed in the field for the first time during CACTI. But there are other parts to consider, says CACTI Principal Investigator Adam Varble, an earth scientist at Pacific Northwest National Laboratory in Washington state.
“We’re calling it a database because it isn’t just the cell tracks,” says Varble. “We’ve been calculating a lot of environmental variables, in particular from the Interpolated Sonde ARM VAP (value-added product), which connects soundings in time, basically to try to get some sense of how the atmospheric column—at least at the AMF site—is evolving in time.”
A Team Effort
Varble is managing a team mostly based at PNNL to analyze CACTI data. Primary support for the work comes from the U.S. Department of Energy’s Atmospheric System Research (ASR) through the Integrated Cloud, Land-Surface, and Aerosol System Study (ICLASS) Scientific Focus Area.
To populate their database, researchers developed a convective cell identification and tracking algorithm to work with the CSAPR2 in complex terrain. The database includes mergers and splits of cells captured every 15 minutes by the radar. Using other AMF data, researchers matched the cells with environmental conditions at and before cell initiation. The team calculated 150 storm-relevant meteorological variables for the database, and aerosol variables from the AMF measurements are next.
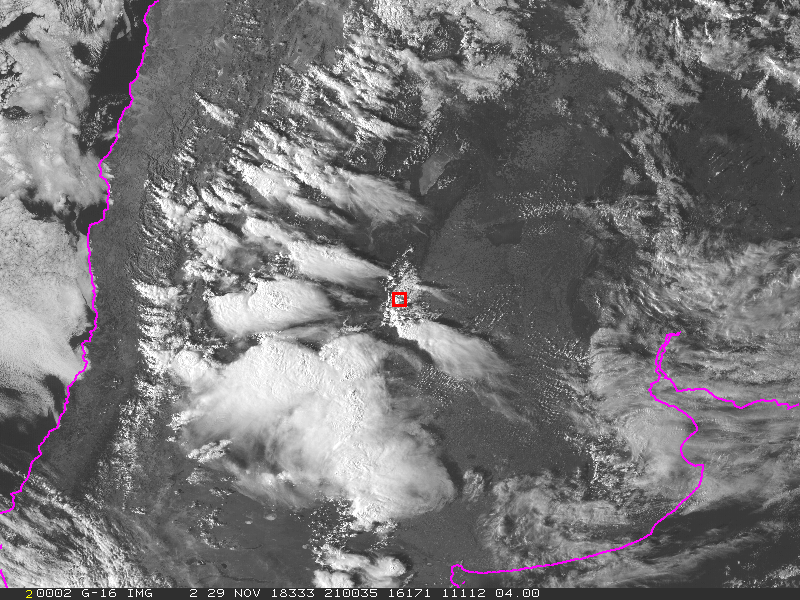
Researchers have also incorporated data from the Satellite Cloud Observations and Radiative Property retrieval System (SatCORPS) hosted by the NASA Langley Research Center in Virginia. With GOES-16 satellite data, the team is tagging variables such as cloud-top temperature and cloud phase (e.g., liquid or ice) to tracked cells.
Another aspect of the database involves calculating and tagging properties of cells captured in vertical radar slices known as hemispheric range-height indicator (RHI) scans. From the vertical scans, the team seeks to extract fine-scale information about storm structure and processes such as precipitation.
“You could run the cell track algorithm with the NEXRAD radar network in the U.S., but you don’t have the AMF site with all the observations we have—you don’t have these RHI scans,” says Varble. “So this is utilizing the unique detailed data sets we have from a field campaign that you don’t have elsewhere. This is where I think the real value comes in.”
Key contributors to the cell tracking and database efforts include Varble and PNNL colleagues Zhe Feng, Joseph Hardin, Alexis Hunzinger, and James Marquis. The database will be made publicly available after some initial papers come out, says Varble.
Focus on Cells
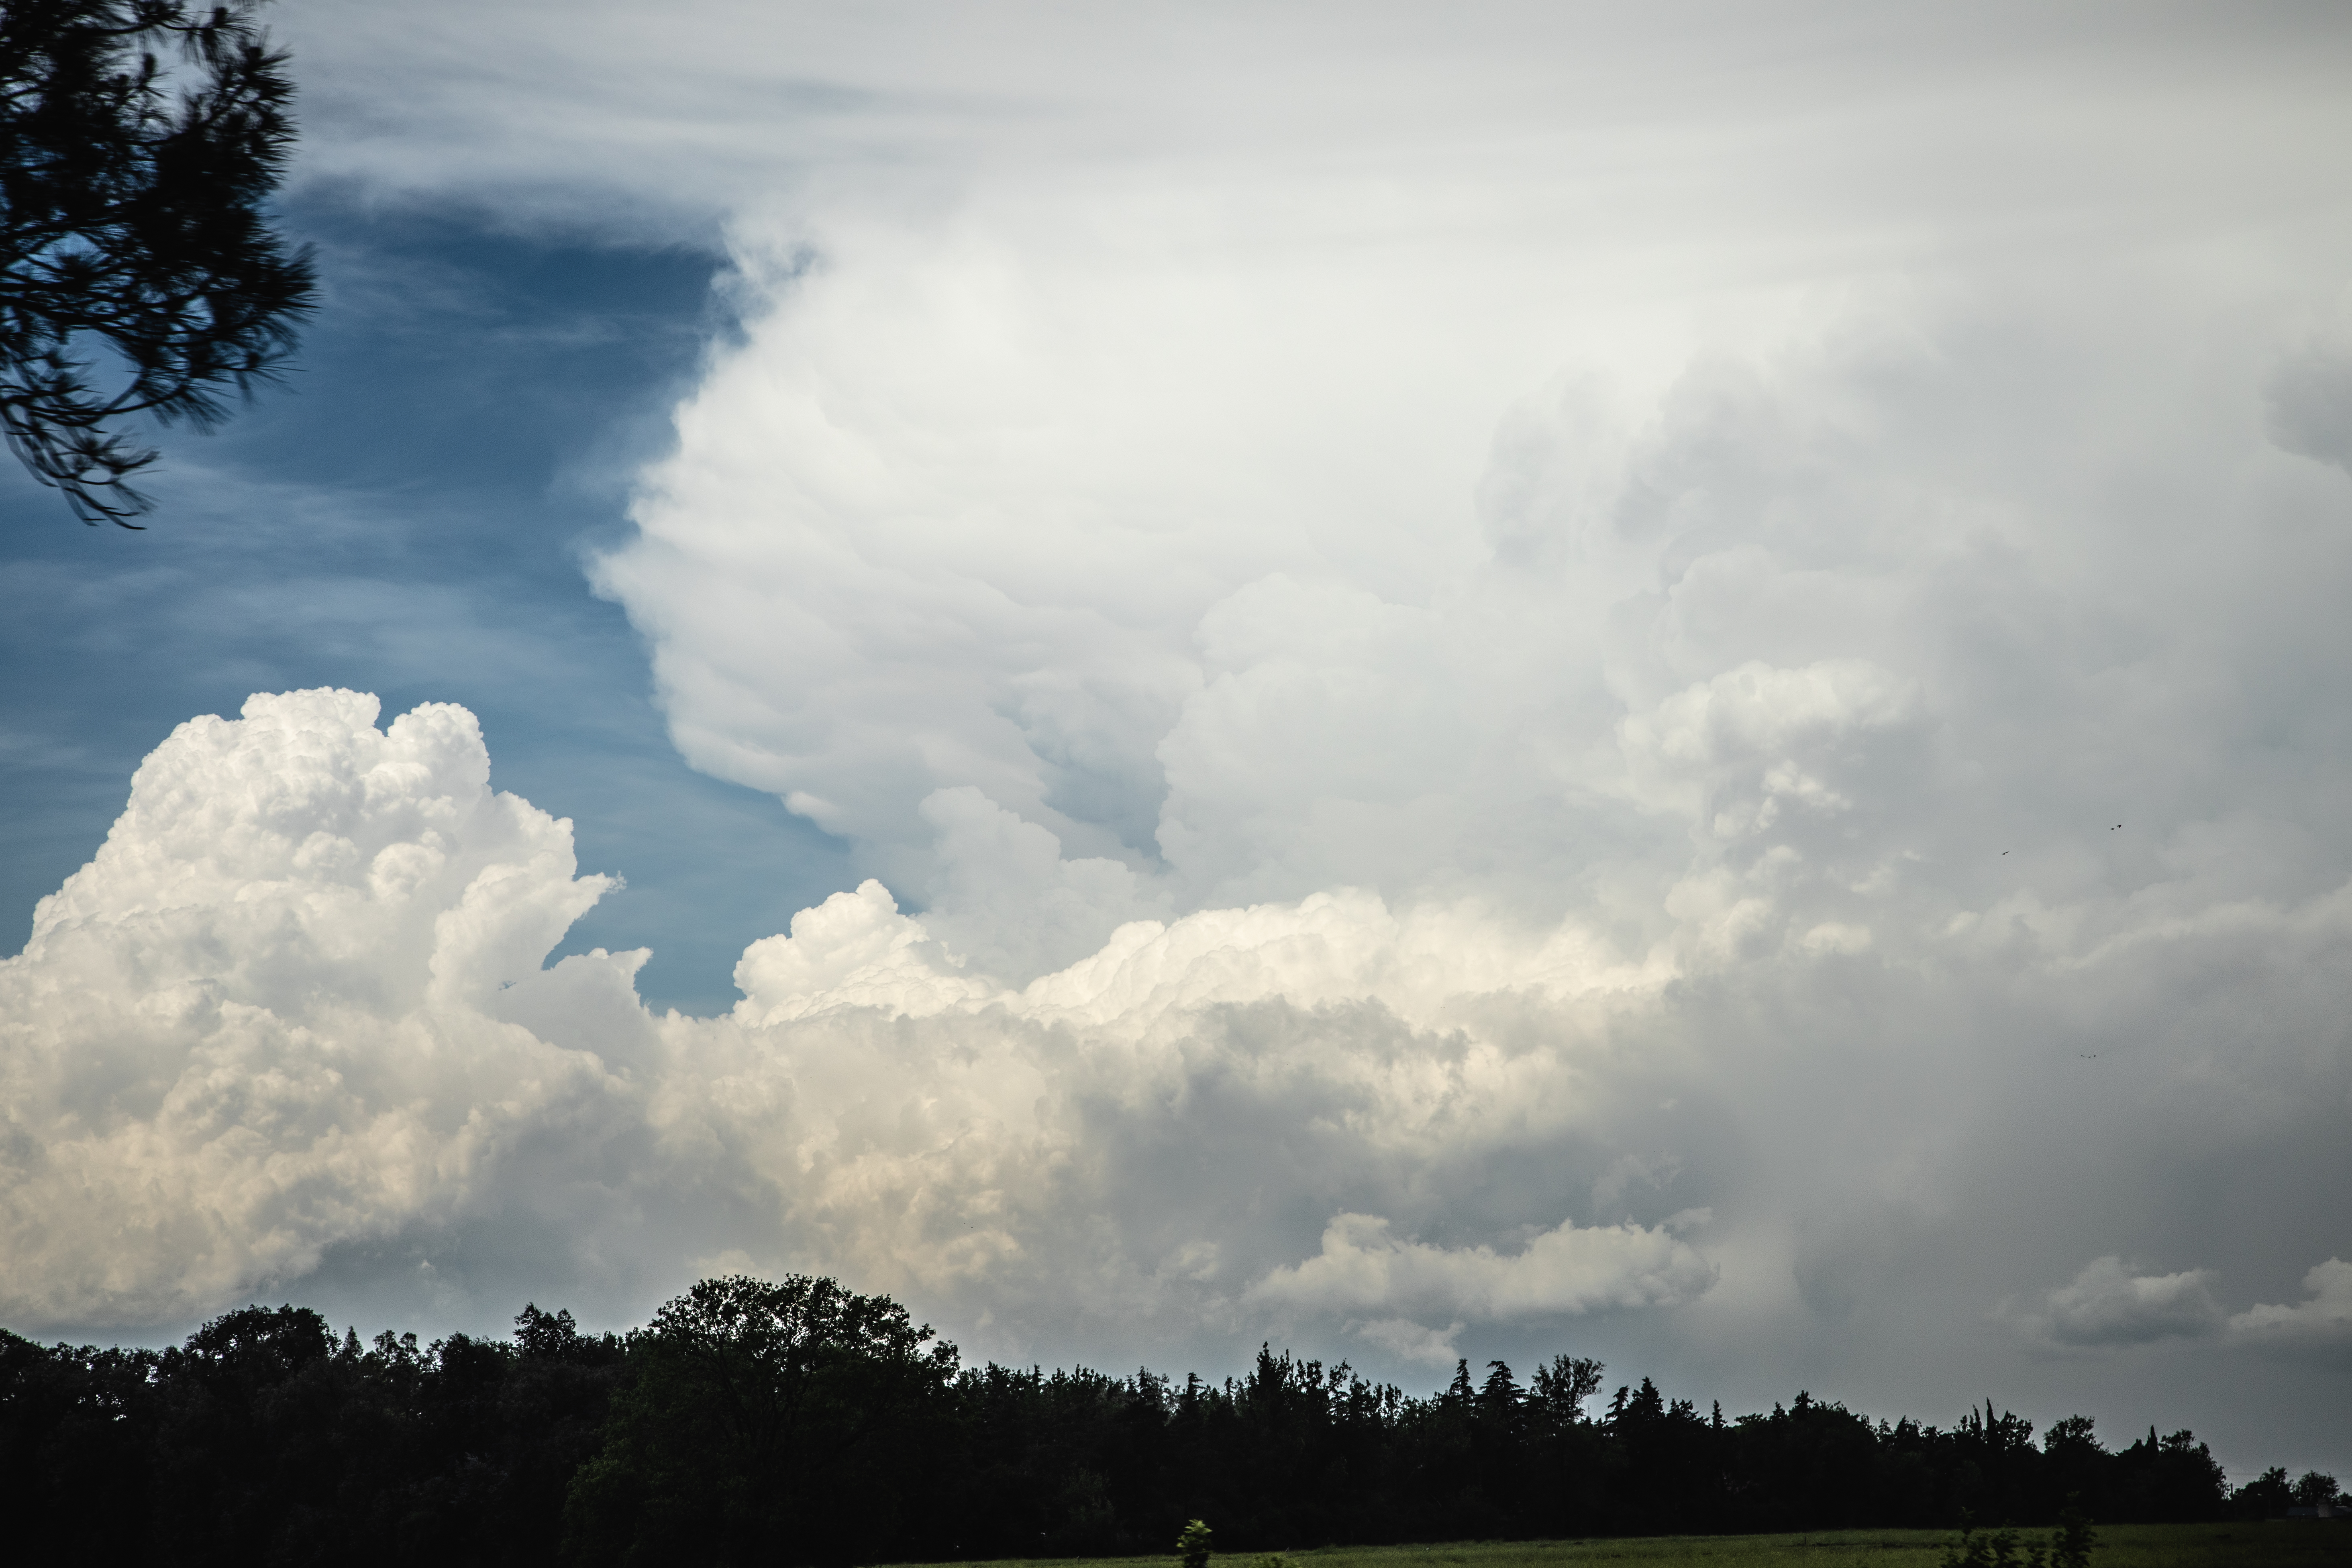
Scientists are looking at information in the database to understand cell initiation and growth processes.
Varble gave an AGU presentation exploring when and where cells tended to form.
According to the data, cell formation typically peaked from 1–2 a.m., 8–9 a.m., and 2–3 p.m. Varble says that surface heating probably contributed to the 2–3 p.m. peak while the 1–2 a.m. peak was likely tied to nocturnal mesoscale convective systems. Researchers are investigating possible causes of the unusual 8–9 a.m. peak.
Studying the locations of cell formation, researchers saw a peak along the eastern slope of the Sierras de Córdoba during the day, likely explained by daytime heating and upslope winds. Overnight, cell formation peaked along the western slope and in the neighboring plains. The surprising overnight peak along the western slope will be a topic of future study, says Varble.
Marquis and Timothy Connor Nelson of the University of Colorado, Boulder, led AGU companion posters examining environmental conditions that support storm formation. This work combines radiosonde (weather balloon) data and large-eddy simulation (LES) modeling to understand why convection succeeded, quickly died out, or did not occur when predicted in certain conditions.
During AMS, Feng shared that cell growth occurred in the late afternoon as the number of cells decreased. Long-lived cells deepened and intensified as atmospheric instability and low-level humidity increased, while vertical shearing of winds promoted larger cells, but only in high-instability conditions.
More Insights and Developments
Researchers also want to know why some storms persist much longer than others. A typical single-cell storm lasts 30 minutes, says Varble, but others can spawn new storms and last for hours.
In work similar to Feng’s, Zhixiao Zhang, a graduate student at the University of Utah, is working with Varble to investigate storm signatures from a modeling perspective. Zhang submitted an AMS poster and gave an oral presentation during AGU.
“We’re basically following the same methodology and setting up the same way, so that we can do this comparison to see if we see the same signatures in the model or, if the model is completely whiffing on certain processes, why that might be,” says Varble. At the same time, he adds, the model will help fill in observational gaps.
Paloma Borque, a PNNL postdoctoral research associate, presented an AGU poster that provided insights into periods of warm shallow clouds identified through using a new cloud type classification algorithm she developed.
Out of 3,000 warm cloud objects identified with the algorithm, about one-third of them formed precipitation below the cloud base—more than Varble expected. Researchers are now looking at what mechanisms contribute to the formation of precipitation in these clouds.
Hardin, who is conducting research into retrievals and quality control of CACTI radar data, presented a set of radar processing algorithms called Taranis during AGU and AMS. Taranis, which multiple research groups are using for CACTI radar data, converts raw data into geophysical quantities (e.g., rain rate, drop size distribution) necessary for studying cloud and precipitation processes.
Going Airborne
CACTI data from the G-1 are another rich information source for researchers.
Peter Veals of the University of Utah presented an AMS poster about the effects of aerosols on deep convective clouds. To determine relationships between aerosol concentration, meteorological variables, and characteristics of deep convective clouds, researchers scrutinized profiles from all 22 G-1 flights and longer-term sounding and surface measurements matched to radar- and satellite-identified deep convection.
Baptiste Testa of the University of Lyon and a group of Colorado State University researchers will soon examine how ice-nucleating particles (INPs) collected at the AMF site correlate with the same measurements from the G-1.
During AGU, Testa shared initial findings showing a lack of a seasonal cycle in INP concentrations. Testa also noted higher concentrations of biological INPs with lower concentrations of organic and inorganic INPs when it significantly rained during and leading up to the INP measurements.
Future Directions
Researchers will continue to analyze data from CACTI and a campaign that ran concurrently in the region, Remote Sensing of Electrification, Lightning, and Mesoscale/Microscale Processes with Adaptive Ground Observations (RELAMPAGO). The Bulletin of the American Meteorological Society (BAMS) recently accepted overview papers on both campaigns.
Also happening is work on the CACTI deep convection scenario for the LES ARM Symbiotic Simulation and Observation (LASSO) activity. William Gustafson, LASSO’s lead principal investigator from PNNL, previewed the scenario during an AMS town hall.
LASSO combines ARM observations and LES modeling to provide data bundles for easier comparison and evaluation.
“I would hope that there will be at least one run of one case done by the end of the calendar year,” says Varble.
The previous LASSO scenario—shallow convection at ARM’s Southern Great Plains atmospheric observatory—dealt with much flatter and simpler terrain than CACTI. The deep convection scenario will require more computational resources to accurately capture the CACTI topography at progressively higher resolutions, but Varble believes the effort will be well worth the expense. Several university teams, he says, recently cited the CACTI LASSO scenario “as a pretty critical component” of proposed research.
Follow Us:


Keep up with the Atmospheric Observer
Updates on ARM news, events, and opportunities delivered to your inbox
ARM User Profile
ARM welcomes users from all institutions and nations. A free ARM user account is needed to access ARM data.


