

The Spatial Structure of Cumulus Clouds
Published: 21 May 2019
A study leverages a new class of convection schemes, ARM data, and supercomputing to look at marine and continental clouds

Research into the spatial structure of clouds—their shapes and distribution—goes back decades, and with good reason. Clouds remain one of the biggest uncertainties in predicting the Earth’s future climate, as well as modeling short-term simulations of weather.
By virtue of their horizontal sizes and diurnal variability, clouds influence surface-atmosphere interactions within the boundary layer, including fluxes of energy, water, and turbulence.
Among other things, scientists modeling atmospheric processes need to know how clouds are distributed in the atmosphere, and in what range of sizes.
Roel A.J. Neggers of the University of Cologne in Germany and Thijs Heus of Cleveland State University are working on a project to simulate cloud-size distributions closer to what they are in nature. Funded by the U.S. Department of Energy’s (DOE’s) Atmospheric System Research program, the 2017‒2020 project draws largely on data from the Atmospheric Radiation Measurement (ARM) user facility.
Their latest paper in a series, this time with University of Cologne co-author Philipp J. Griewank, is published online by the Journal of the Atmospheric Sciences. It investigates the spatial structure of cumulus cloud populations by using three-dimensional snapshots of large-domain large-eddy simulations.
They and other researchers grapple with one stubborn fact in the realm of cloud-prediction uncertainty: Cumulus clouds, though vastly numerous, can be very small—as little as 100 meters, or 328 feet, across.
That makes shallow cumulus clouds difficult to recognize in global climate model schemes with data-capture grids typically 100 kilometers (62 miles) across. Even leading-edge global climate model grid cells are pretty big: 25 kilometers (16 miles) across.
DOE “is hoping to run 3-kilometer (1.8-mile) grid cells in about a decade,” says William Gustafson, an atmospheric scientist at Pacific Northwest National Laboratory in Washington state.
However, cautions Heus, even a refinement in resolution as significant as 3 kilometers “would still not be sufficient to resolve these clouds.”
Gustafson is principal investigator for the Large-Eddy Simulation (LES) ARM Symbiotic Simulation and Observation (LASSO) workflow, a tool employed by Neggers and Heus in their recent work.
How LASSO Helps
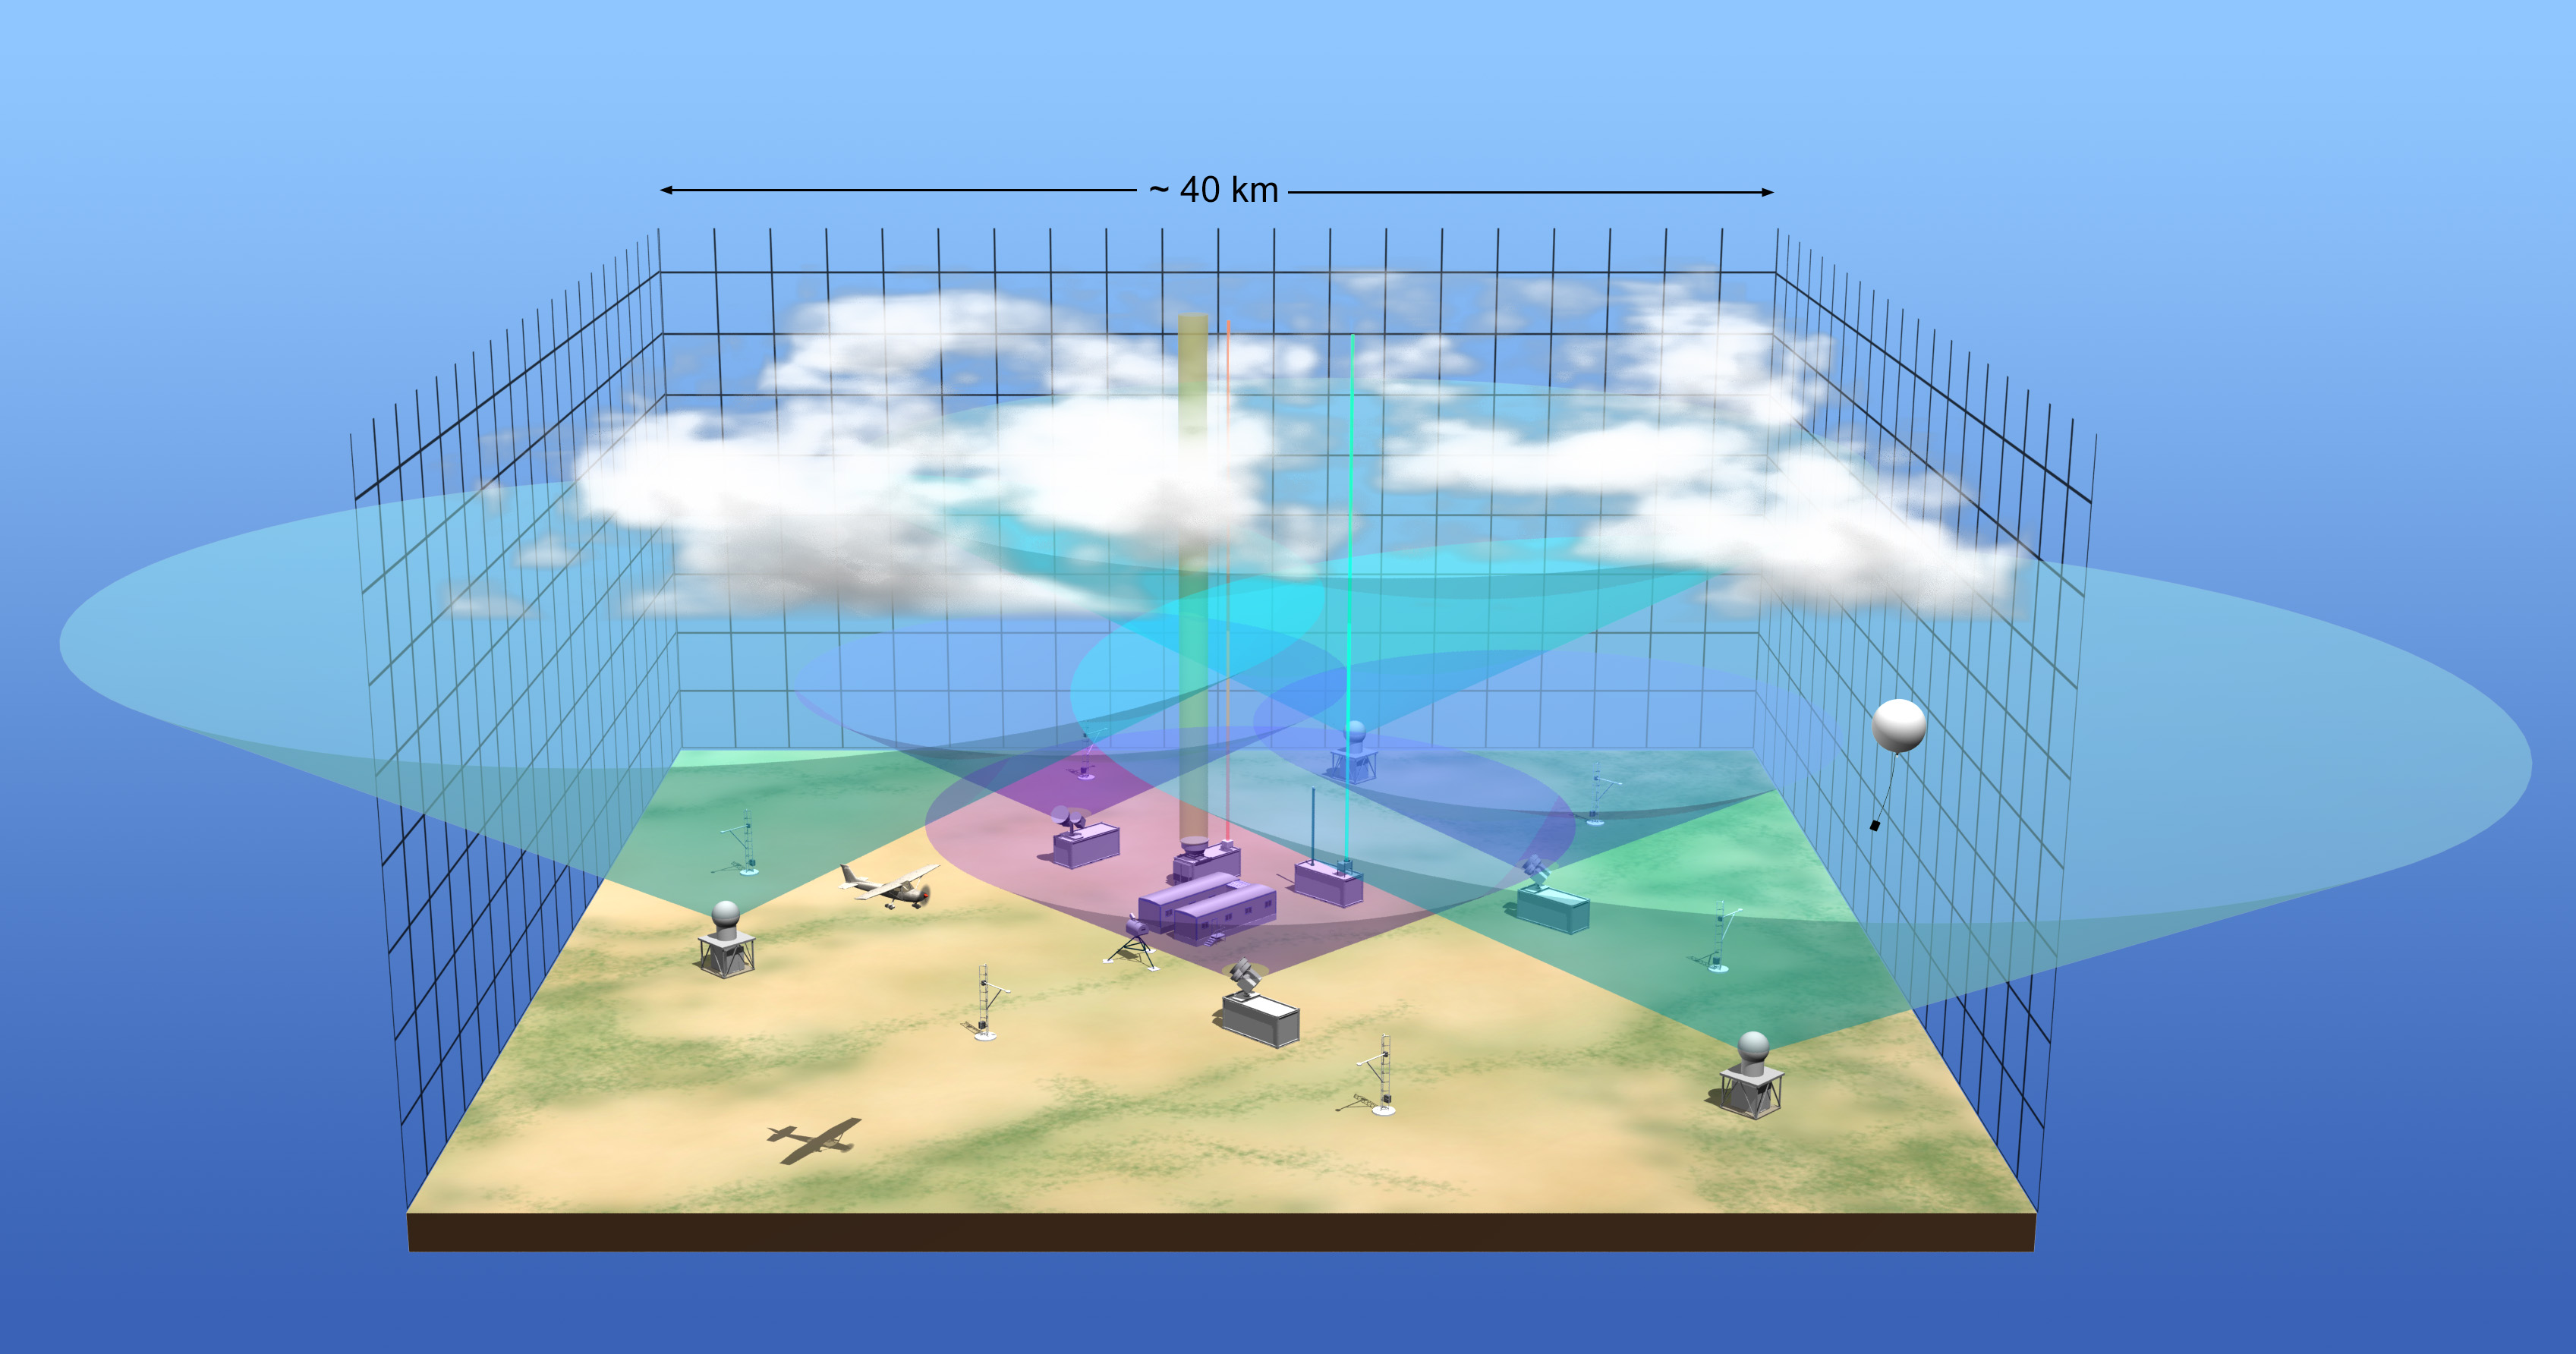
ARM crafted LASSO, a simulation library, to complement observational data. It’s currently focused on shallow cumulus clouds over ARM’s Southern Great Plains atmospheric observatory.
LASSO helps researchers get extra mileage from rich new data on cumulus clouds that have accumulated in the past 15 years. The data, which are from area-covering and vertically pointing instruments, are converging with advances in supercomputing to bring new insights into the ways cumulus clouds are distributed.
The Neggers-Heus-Griewank study uses six cases. One looks at slowly organizing marine precipitating clouds. Five others, all from the LASSO simulation library, look at more quickly organizing clouds over land.
Among numerous insights into cumulus cloud-size distribution, the authors propose a scaling relation they say provides a new way to objectively estimate the degree of organization in simulated or observed cumulus cloud populations.
For a related LASSO paper by Heus, and to link to a library of LASSO case studies, go to this ARM article.
Follow Us:


Keep up with the Atmospheric Observer
Updates on ARM news, events, and opportunities delivered to your inbox
ARM User Profile
ARM welcomes users from all institutions and nations. A free ARM user account is needed to access ARM data.


