

LASSO Case Study: Improving How We See Cloud Distributions
Published: 22 January 2019
Researchers combine fine-scaled observations with high-resolution LASSO runs to more accurately model the distribution of shallow cumulus clouds
Cleveland State University atmospheric scientist Thijs Heus (pronounced “Tice Hoos”) is willing to begin at the beginning.
“Everybody knows what a cloud is,” he says, gesturing upward in a video explaining the work he and his lab colleagues do. They use large-scale computer simulations to uncover the physics of how clouds form, grow, organize, and transport heat and moisture.
The goal of their work is to improve both weather forecast and climate models. With so much data on hand, some of the Cleveland State model simulations take two weeks to run on a high-performance supercomputer—the equivalent of two centuries on a commercial laptop.
Heus and others are investigating a durable fact about clouds—that these visible but ephemeral formations of water droplets and ice particles are what he calls “one of the biggest uncertainties in climate predictions.”
One reason is that models tend to represent only the mean effect of clouds in “bulk models that we’ve been using for 30 or 40 years,” says Heus.
Those representations—parameterizations—of clouds in bulk have to represent all the shallow clouds too small to be recognized, or resolved, in climate models.
The highest-resolution weather models divide the atmosphere into discrete units—grids that are 2 kilometers (1.24 miles) across, and normally much larger. Yet some clouds are less than 1 km (0.62 miles) wide, and may span as little as 100 to 500 meters (328 to 1,640 feet) horizontally.
“Some of the biggest clouds may be resolved by weather models, but the smallest clouds are not,” says Heus, making bulk-effect parameterizations “not really valid anymore.”
Getting clouds right in models is important work. Their horizontal size and diurnal changes influence surface-atmosphere interactions within the boundary layer, including fluxes of energy, water, and turbulence.
Researchers use cloud-size distributions to calculate these fluxes of mass and energy in models, and to evaluate models in comparison to observations.
To improve the way models simulate clouds, Heus and colleague Roel A.J. Neggers of the University of Cologne in Germany have embarked on a project to make a model that reproduces cloud-size distributions closer to what they are in nature.
The “Size Decompositions of Observed and Simulated Shallow Convective Cloud Fields” project, which is running from 2017 through 2020, is funded by the Atmospheric System Research (ASR) program, part of the U.S. Department of Energy (DOE).
“We want to start understanding, given a cloud field, how many clouds are large and how many clouds are small—the cloud-size distribution,” says Heus. “And what the properties of the large and small clouds are.”
How LASSO Helps
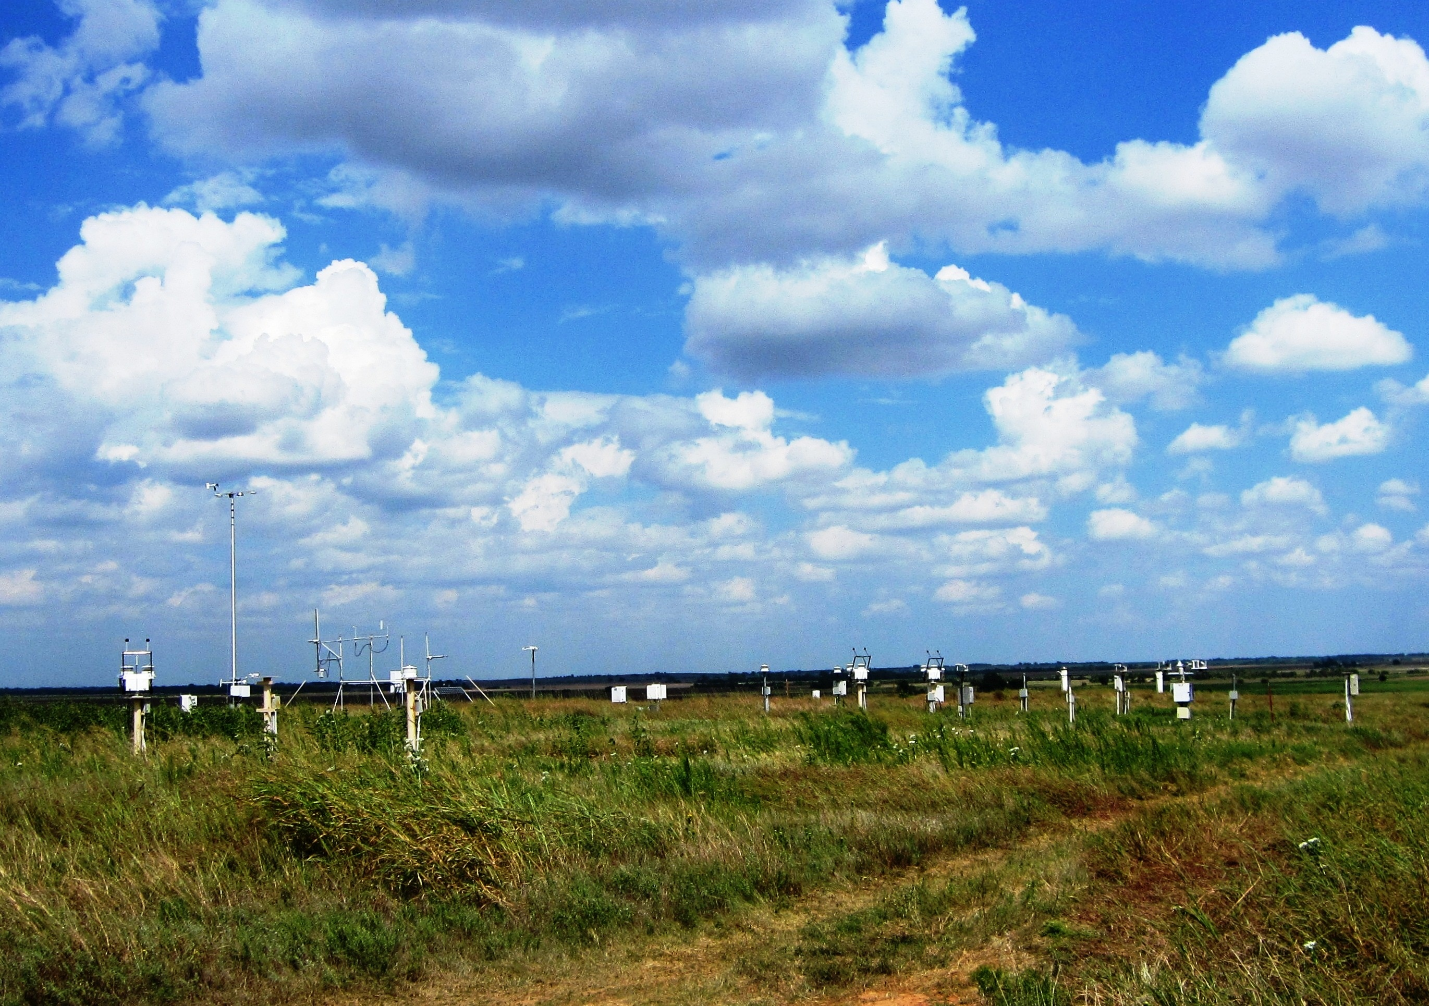
Improving model simulations of cloud distribution in climate and weather models requires data from high-quality continuous observations. Heus and his collaborators are getting those data from the Southern Great Plains (SGP) atmospheric observatory, managed by DOE’s Atmospheric Radiation Measurement (ARM) user facility.
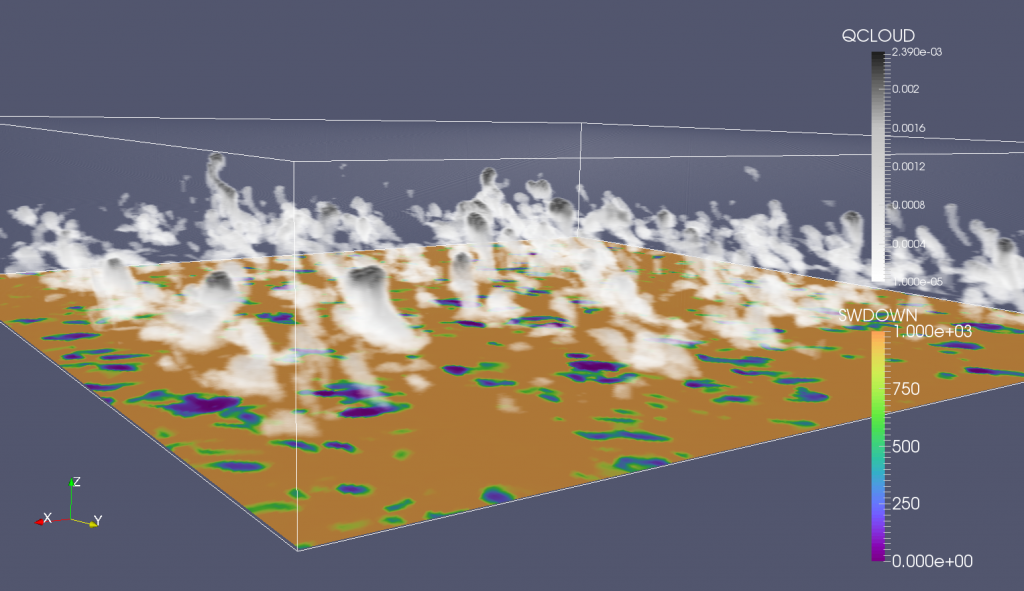
From there, they draw on an archive of ARM routine large-eddy simulations (LES) designed to complement ARM observations. This simulation library, based on daily routine measurements at the SGP, is called the LES ARM Symbiotic Simulation and Observation (LASSO) workflow.
LASSO makes 3D modeled cloud fields, statistics, and model inputs easily accessible. That way, researchers can test their models by using statistical approaches beyond single cases.
“All we want is a big database of cumulus clouds, for statistical power,” says Heus, and LASSO provides that. “There’s plenty of data to evaluate.”
LASSO’s routine model simulations capture the evolution of shallow cumulus clouds at the SGP. The data are packaged in data bundles from a library of cloudy days chosen by the LASSO project team at Pacific Northwest National Laboratory in Richland, Washington, and Brookhaven National Laboratory in Upton, New York.
The LASSO simulations are archived in fine-scale grids 100 meters across.
“But we want to include all the smallest clouds,” says Heus. “So we are rerunning them at a 25-meter resolution.”
The Best Observations
The convenience of LASSO remains, of course, Heus adds. “We have to do one run instead of a hundred. We know the input settings are good—the best (observations) available for that particular day.”
Observations on a given cloudy day over the SGP comes right out of the bundled LASSO data set. The data are scored by the LASSO team, which so far has created data sets on low cumulus clouds for 2015 through 2017.
The whole suite of scored comparisons between observations and simulations include many factors that influence climate and weather, such as liquid water path, cloud cover, cloud height, water vapor, and temperature.
On the fly, during an interview, Heus called up the LASSO data website for May 18, 2016, selected all the associated data bundles, pressed submit, and got 39 simulations for the day.
Some data were from direct observations at the site, some were from the Weather Research and Forecasting (WRF) model, and others from the European Centre for Medium-Range Weather Forecasts (ECMWF) model, and so on.
Choosing liquid water path as a factor, Heus got a “skill score” of 93 percent. (A skill score rates accuracy of the simulation versus the observations, in part by combining bias and standard deviation.)
“What Thijs is doing is really great stuff, and needs to be done,” says National Oceanic and Atmospheric Administration (NOAA) meteorologist Dave Turner, who converses with Heus frequently on related projects. “Getting these cloud distributions right is very important for getting the solar energy distribution at the surface correct.”
Turner is part of a NOAA team that builds operational weather forecast models, and that has a scheme that simulates subgrid clouds. NOAA colleague Wayne Angevine is using LASSO data to see how well the scheme works.
Leveraging Large-Scale Variables
LASSO streamlines model-testing by assuring the quality of observational data, says Turner.
He was principal investigator on a related 2015−2018 ASR project looking at how well LES models capture turbulent motions relative to lidar observations in the boundary layer when it is cloud-free. Heus is a co-investigator, along with Richard Ferrare of NASA.
Turner’s ASR problem is attempting to parameterize turbulent motions by correlating them with large-scale variables already on hand (temperature, humidity, wind speed) in order to suggest a simulated spectrum of turbulent mixing.
Similarly, “this is what Thijs and Roel (Neggers) are working on,” says Turner of the LASSO-related ASR project Heus is leading. “How do we use these large-scale variables to predict subgrid clouds and put those clouds into the radiation scheme? These (small) clouds are not resolved, but their behavior has to be represented.”
Aside from LASSO, Heus and Neggers are using their 2017−2020 ASR cloud-distribution modeling project to collaborate with two university professors who are observationalists: Neil Lareau at the University of Nevada, Reno, and Jessica Kleiss at Lewis & Clark College in Portland, Oregon.
Lareau investigates the air immediately below cloud layers. Kleiss is poised to contribute data from total sky imaging.
“It’s a pretty cool part of the project, but just in its starting phase,” says Heus of the Kleiss contribution. “The idea is to take visual data and compare it to your simulations.”
In the next few years, Heus and his modeling collaborators in Ohio and Germany “will constantly try to combine LES and LASSO data with observations to make sense of cloud size, distribution, and the properties of the clouds,” he says. “That will be stronger as the project goes on.”
Follow Us:


Keep up with the Atmospheric Observer
Updates on ARM news, events, and opportunities delivered to your inbox
ARM User Profile
ARM welcomes users from all institutions and nations. A free ARM user account is needed to access ARM data.


