

Large-Scale Forcing Data Released for TRACER Campaign
Published: 8 January 2024
Continuous large-scale forcing data are now available for the TRacking Aerosol Convection interactions ExpeRiment (TRACER), conducted by the Atmospheric Radiation Measurement (ARM) user facility from October 2021 through September 2022 in the Houston, Texas, area.
The derived forcing data are based on a constrained variational analysis approach (Zhang and Lin 1997; Zhang et al. 2001).
Scientists can use this value-added product (VAP), known as VARANAL, to drive single-column models, cloud-resolving models, and large-eddy simulation models for different cloud and convective systems. To help validate model simulations, the VAP includes diagnostic fields such as diabatic heating profiles, cloud fields, surface measurements, and large-scale conditions.
Two evaluation versions of VARANAL are available for TRACER. Version 0 (v0) is based on the European Centre for Medium-Range Weather Forecasts (ECMWF) Reanalysis version 5 (ERA5). Version 1 (v1) is based on ERA5 but constrained with surface rainfall retrieved from a radar-only quantitative precipitation estimation product provided by NOAA’s Multi-Radar/Multi-Sensor System (MRMS; Zhang et al. 2020).
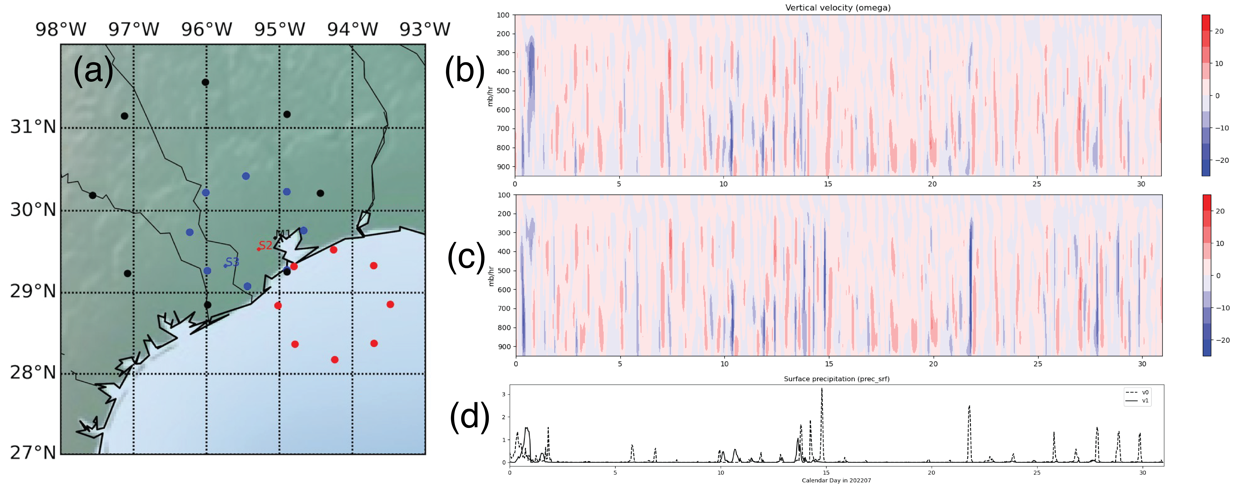
Both versions feature three data sets, each with a different variational analysis domain: 1) a 75-kilometer radius domain over land, 2) a 75-km radius domain over ocean, and 3) a 150-km radius domain over land. The analysis domain represents land/ocean only to exclude the impact of different surface types on the observed surface radiative and turbulent heat fluxes.
Each data set represents an average over the analysis domain, so users need to be cautious when comparing the forcing data with ARM single-point measurements.
For all three domains, large differences exist between the precipitation from ERA5 (v0) and MRMS (v1), especially during July, August, and September 2022. As a result, the derived large-scale forcing fields are different between v0 and v1. Scientists should use v1 when available, especially during precipitation periods, because precipitation is a strong constraint used in the variational analysis approach. The constraining effect of the MRMS rainfall data is shown in the figure below.
While v0 is available for the entire TRACER campaign, v1 is not available for October 2021 and April and June 2022 because of too many missing MRMS data.
The v0 and v1 evaluation data are in netCDF format, with a time resolution of 60 minutes and vertical resolution of 25 mb.
More information about VARANAL can be found on the VAP web page.
Scientists can begin using the TRACER VARANAL data for model simulation and evaluation. Access v0 and v1 in the ARM Data Center. (To download the data, first create an account.)
To ask questions, report data problems, or provide feedback on these evaluation data, please contact Cheng Tao or Shaocheng Xie. More details about ARM continuous forcing data are in Xie et al. (2004).
The v0 data can be referenced as doi:10.5439/1993355. To cite the v1 data, please use doi:10.5439/1993354.
References:
Zhang M and J Lin. 1997. “Constrained Variational Analysis of Sounding Data Based on Column-Integrated Budgets of Mass, Heat, Moisture, and Momentum: Approach and Application to ARM Measurements.” Journal of the Atmospheric Sciences, 54(11), 1503-1524, doi:10.1175/1520-0469(1997)054<1503:CVAOSD>2.0.CO.
Zhang M, J Lin, RT Cederwall, JJ Yio, and SC Xie. 2001. “Objective Analysis of ARM IOP Data: Method and Sensitivity.” Monthly Weather Review, 129(2), 295-311, doi:10.1175/1520-0493(2001)129<0295:OAOAID>2.0.CO;2.
Zhang J, L Tang, S Cocks, P Zhang, A Ryzhkov, K Howard, C Langston, and B Kaney. 2020. “A Dual-Polarization Radar Synthetic QPE for Operations.” Journal of Hydrometeorology, 21, 2507-2521, doi:10.1175/JHM-D-19-0194.1.
Xie S, RT Cederwall, and MH Zhang. 2004. “Developing long-term single-column model/cloud system–resolving model forcing data using numerical weather prediction products constrained by surface and top of the atmosphere observations.” Journal of Geophysical Research: Atmospheres, 109(D1), D01104, doi:10.1029/2003JD004045.
Follow Us:


Keep up with the Atmospheric Observer
Updates on ARM news, events, and opportunities delivered to your inbox
ARM User Profile
ARM welcomes users from all institutions and nations. A free ARM user account is needed to access ARM data.


