

Stereo Camera Cloudiness Map Product Moves to Production
Published: 9 October 2023
The Clouds Optically Gridded by Stereo value-added product (COGS VAP) is now in production for the Atmospheric Radiation Measurement (ARM) user facility’s Southern Great Plains (SGP) atmospheric observatory.
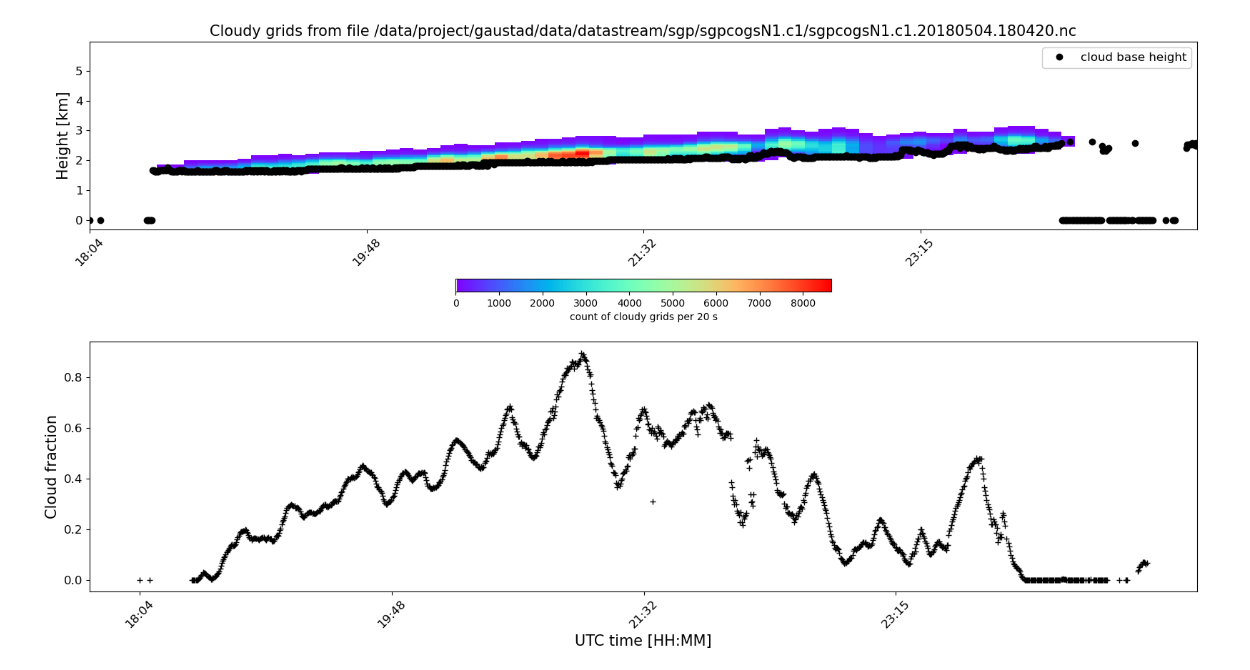
COGS provides a four-dimensional (4D) map of cloudiness, which is generated from multiview stereo reconstruction using a ring of stereo cameras at the SGP. The VAP also includes a vertically projected cloud fraction and cloud base height estimate. These data are useful for studying the life cycles and macrophysical attributes of shallow cumulus clouds.
COGS is produced by stitching together three-dimensional (3D) reconstructed cloud points from the SGP’s three pairs of stereo cameras. It covers a 6-by-6-by-6-kilometer region of the SGP Central Facility centered at the position of the Doppler lidar. The grid resolution is 50 meters in horizontal and vertical directions and 20 seconds in time.
Production data are available from September 1, 2017, through October 27, 2019. Access the data in the ARM Data Center. (To download the data, create an ARM account.)
The images and cloud point data used to generate COGS are also available in the ARM Data Center as the Point Cloud of Cloud Points (PCCP) VAP.
More information about COGS is available on the VAP web page. To ask questions or provide feedback, please contact Rusen Öktem or David M. Romps.
To cite the COGS data, please use doi:10.5439/1877293.
Follow Us:


Keep up with the Atmospheric Observer
Updates on ARM news, events, and opportunities delivered to your inbox
ARM User Profile
ARM welcomes users from all institutions and nations. A free ARM user account is needed to access ARM data.


