

ARM CACTI Radar Data Ascend to New Level of Usability
Published: 18 May 2020
Highly characterized data from Argentina achieve data epoch status
The 2018‒2019 Cloud, Aerosol, and Complex Terrain Interactions (CACTI) field campaign captured unique views of convective clouds in central Argentina. During the seven-month campaign, radars operated by the Atmospheric Radiation Measurement (ARM) user facility observed 80 days with deep convective activity passing directly over the site. These data, collected in one of the world’s storm-generating hotspots, are already proving valuable to researchers wanting to study the transition from shallow to deep convection.
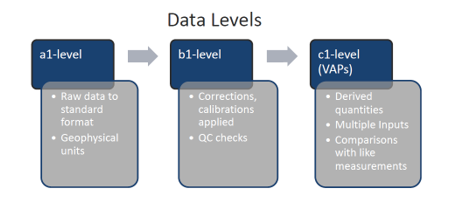
Now, the potential for using these data has grown even more, thanks to the recent arrival of b1-level radar data products for CACTI in the ARM Data Center. These b1-level products underwent calibration, correction, and quality control processes beyond ARM’s standard quality checks and corrections.
“This is the first time we’ve really been able to do it in a quantitative way with the radar systems,” says Jennifer Comstock, ARM’s engineering and process manager. Comstock is also responsible for ARM data products.
These highly characterized CACTI data—collectively known as a data epoch—can lessen uncertainty in retrievals such as particle phase or size distribution.
Available Products
The b1-level data products are available from the four radars that ran as part of the first ARM Mobile Facility (AMF1) during CACTI from October 2018 through April 2019:
- the second-generation C-Band Scanning ARM Precipitation Radar (CSAPR2), which was on its first deployment
- the Ka- and X-band scanning ARM cloud radars (KASACR and XSACR)
- the Ka-Band ARM Zenith Radar (KAZR).
A report led by Joseph Hardin, a computational scientist at Pacific Northwest National Laboratory (PNNL) in Washington state, summarizing the work on the b1-level products is available on arm.gov.
Others at PNNL and ARM radar science translators from Brookhaven National Laboratory (BNL) in New York also contributed to the report. The team included Nitin Bharadwaj (former ARM radar engineering lead), CACTI principal investigator Adam Varble, Alexis Hunzinger, Alyssa Matthews, and Eddie Schuman of PNNL; and Scott Giangrande and Karen Johnson of BNL.
All Eyes on the Radars
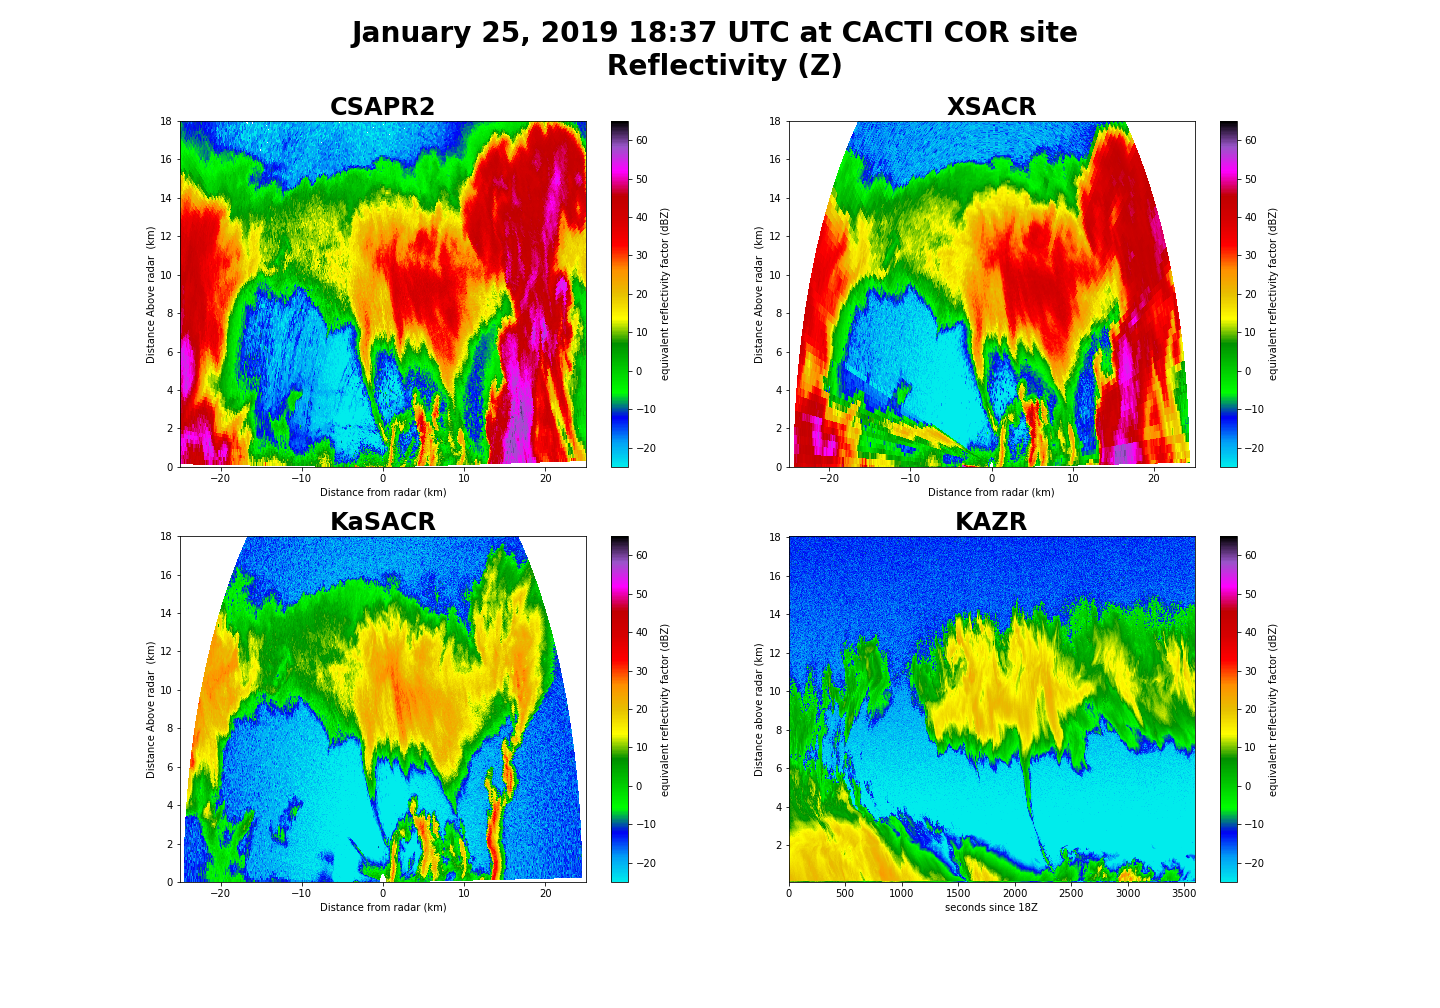
Together, the radar data collected during CACTI constructed a more complete picture of the convective cloud life cycle over the Sierras de Córdoba mountain range.
Thousands of miles from Argentina, the radar team kept close watch over the information coming back from the instruments and stayed in regular contact with the technicians at the AMF1 site. Bharadwaj, Hardin, and Varble reviewed quicklook images to get a glimpse of what the radars were observing or to spot problems during the campaign. A surveillance camera at the site helped the team see when a radar was out of position.
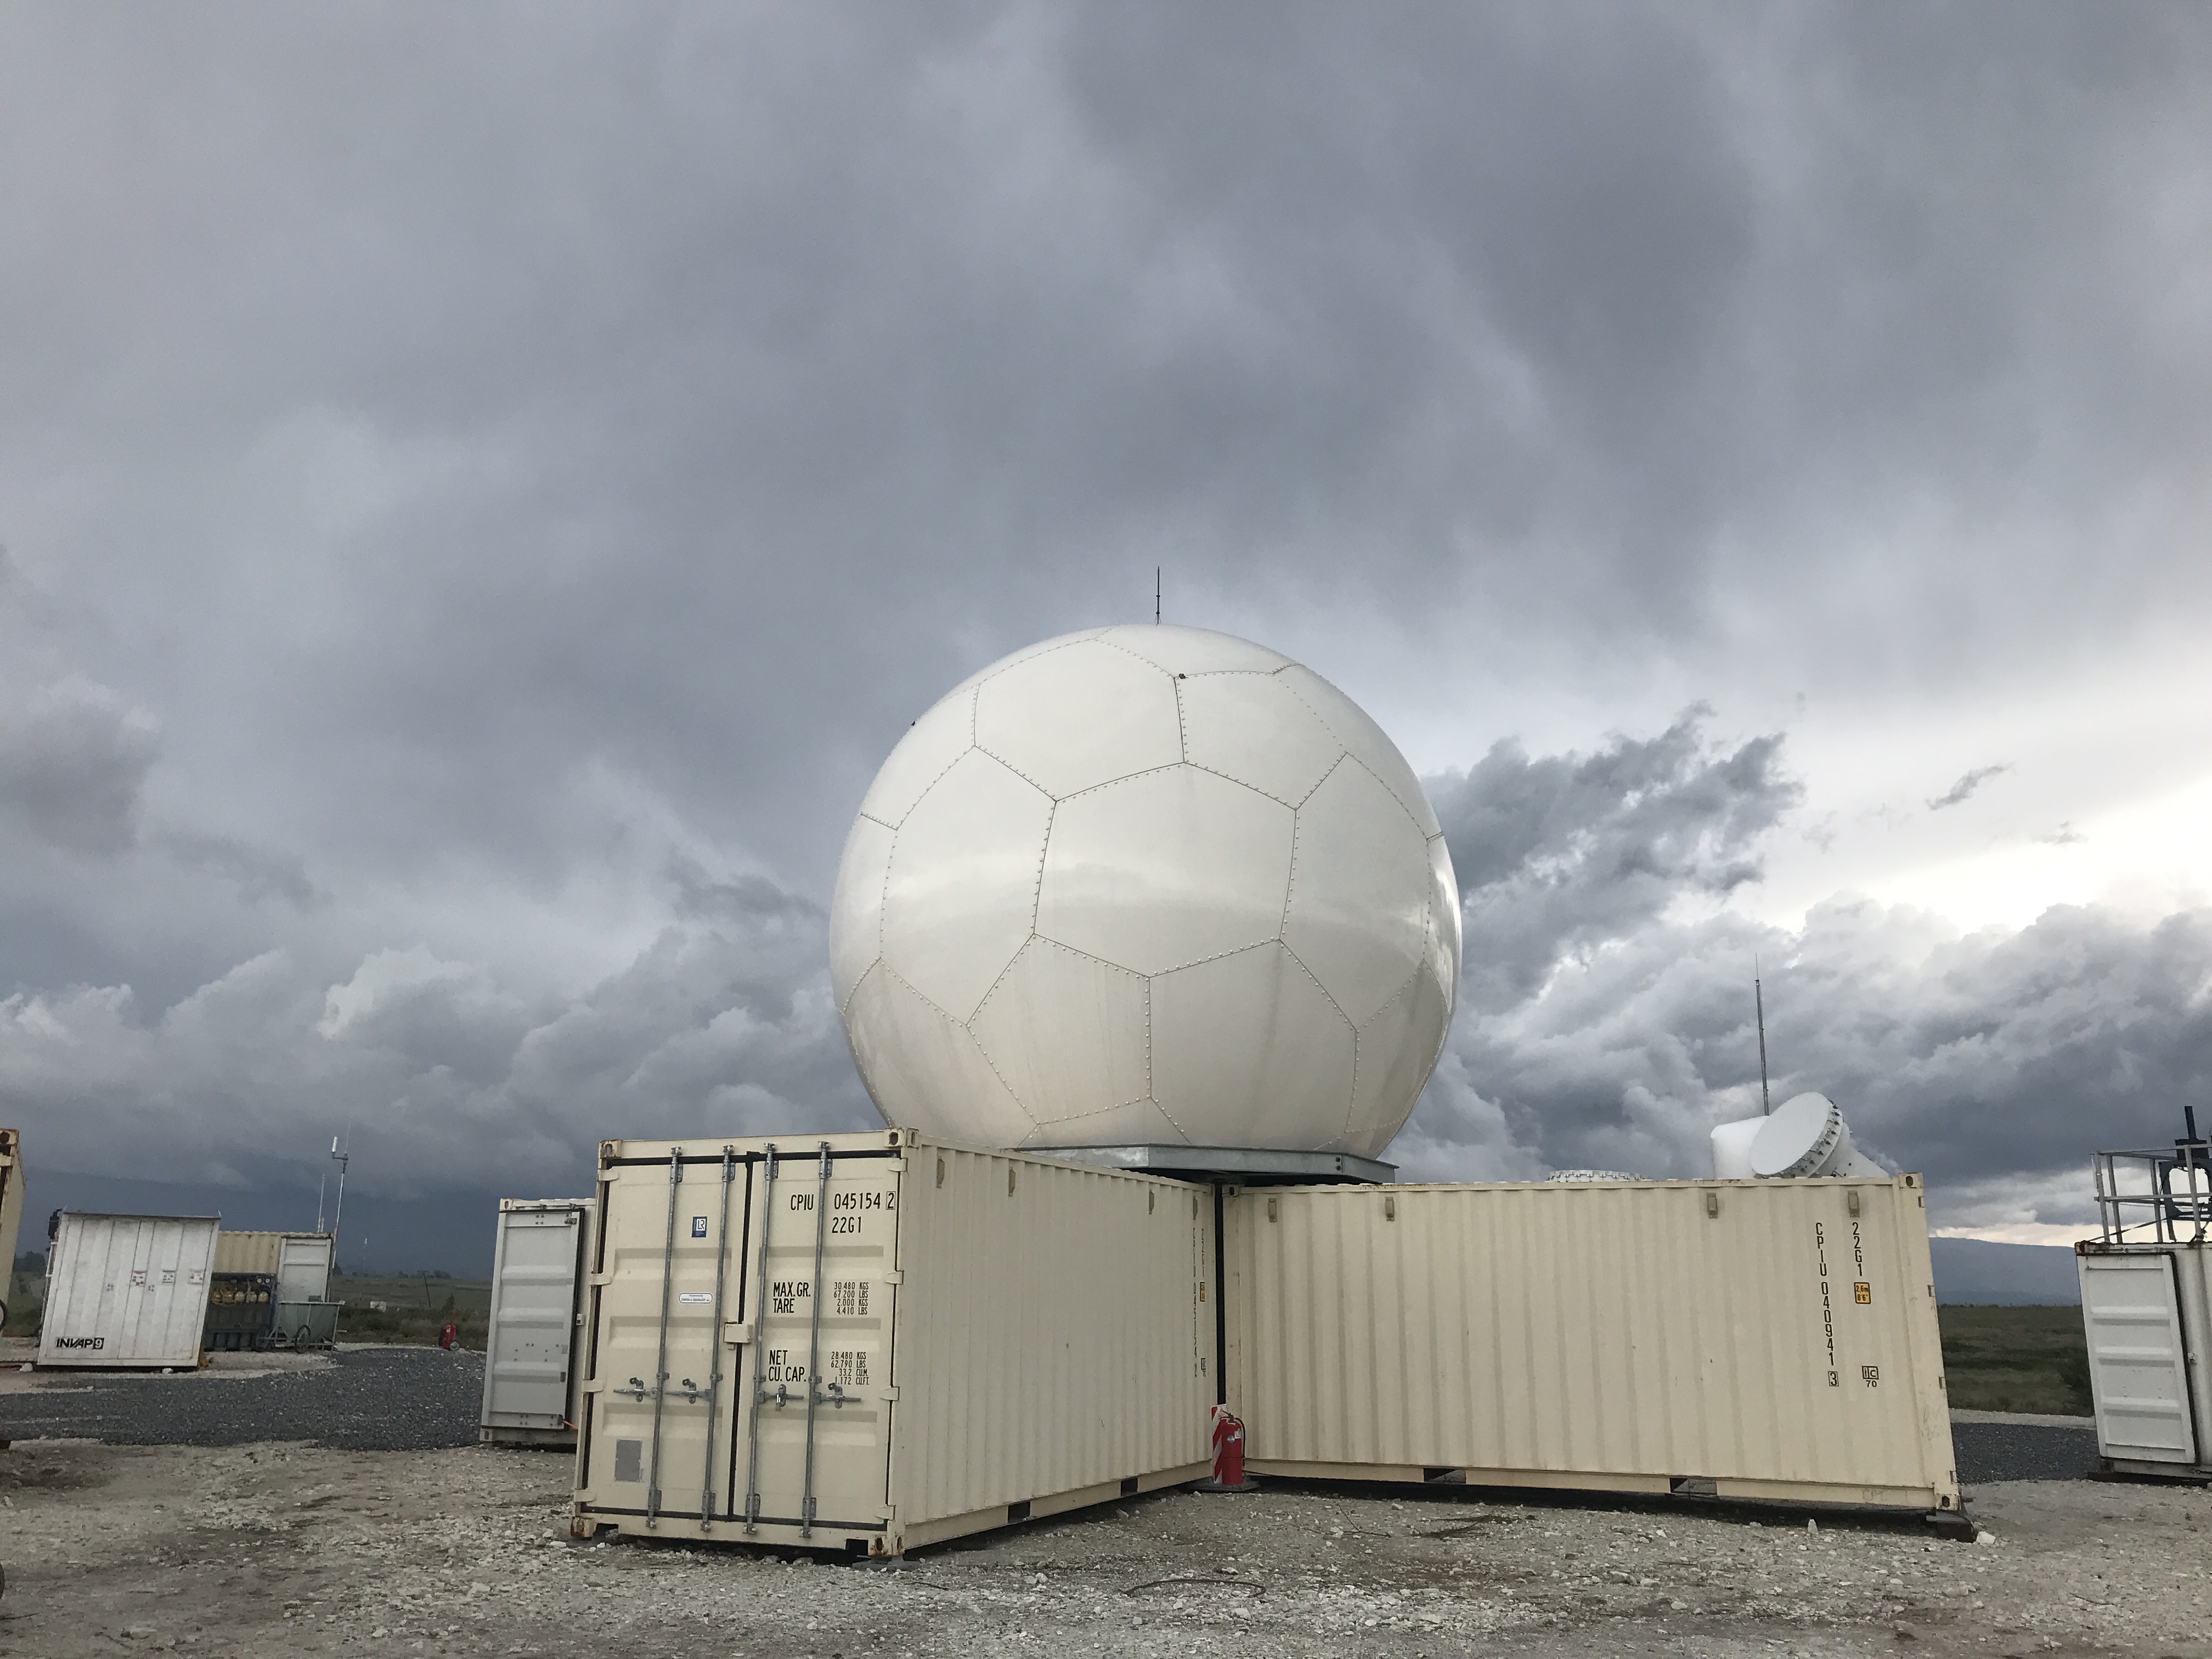
Paying close attention helped with the KASACR. After a calibration result using an installed corner reflector was significantly off from what was expected, site operations staff found and cleaned out debris in the waveguide.
The team used three different scan strategies during CACTI, including an “agile scanning” approach that allowed an engineer to set some variables and leave the rest under the radar system’s control.
In late February 2019, the CSAPR2 stopped scanning in azimuth mode because of a mechanical problem, which meant it could no longer rotate. Campaign investigators and ARM staff worked together to redesign the radar scan strategy.
“We could change the height we were looking at, so we just set it up to do that repeatedly,” says Hardin. “That means we have 45-second update scans compared to the normal 15-minute scans.”
Varble adds that the new strategy for the CSAPR2 “gave us a vertical slice along the east-west line, basically constantly for the rest of the campaign, because it couldn’t rotate.”
A New Approach to a Long-Standing Technique
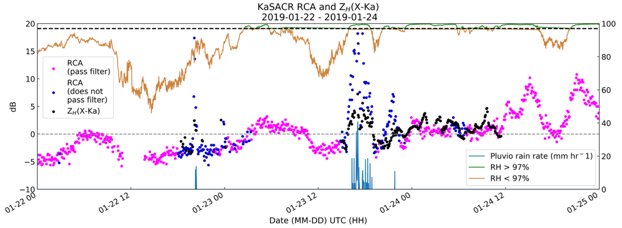
To calibrate and correct radar reflectivity, the team applied several techniques, including cross-comparisons between the radars and a new take on a 40-year-old method called relative calibration adjustment (RCA).
Trees, mountains, buildings, and other static objects in the radar beam’s path are known as ground clutter. Because this clutter does not change, it should reflect the same amount of power back to the radar each time. Therefore, the return from ground clutter plus the return from weather should equal the total amount of power returned to the radar.
Removing weather from the equation, if the amount of power returned by the ground clutter varies from what is expected, that usually indicates issues with the radar.
During an in-depth look at data using the RCA technique, the radar team saw an odd trend in RCA values compared with relative humidity. The team suspects that condensation was forming on the radomes—the enclosures that protect the KASACR and KAZR antennae. Similarly, RCA helped detect drifting components and errors in configuration on the other radars.
Previously, RCA was only used for scans at a constant elevation (plan position indicator, or PPI, mode) and no higher than the C-band frequency. The radar team extended the technique to use it for all three bands used during CACTI—C, X, and Ka—and for scans at varied elevations (range-height indicator, or RHI, mode). The team also added modifications to increase the calibration tool’s stability in diverse environments.
This work is discussed in a paper that is currently under review. The team’s calibration tool, dubbed enhanced RCA (eRCA), is publicly available as a GitHub open-source release.
“The idea is that we’ll have it in a user-friendly kind of format so other radar users can use it for their calibration tracking,” says Hunzinger. “Since we found that it was such a useful tool, we figured that’s a contribution to the radar community.”
Dive Into the CACTI Data Epoch
In addition to the calibration and correction work, the team added data quality masks for signal-to-noise ratio to KASACR and XSACR files.
All of the work done on CACTI’s radar data will benefit similar data from future field campaigns, as well as ARM radar value-added products such as Active Remote Sensing of Clouds (ARSCL).
“This will just make them that much more reliable and reduce the uncertainty in retrievals,” says Comstock.
The available CACTI b1-level radar datastreams and their DOIs are:
- CSAPR2
- Hemispherical RHI scan (corcsapr2cfrhsrhiqcM1.b1) = doi:10.5439/1615607
- RHI sector scan (corcsapr2cfrrhiqcM1.b1) = doi:10.5439/1617690
- PPI scan (corcsapr2cfrppiqcM1.b1) = doi:10.5439/1615604
- Zenith-pointing PPI scan (corcsapr2cfrzppiqcM1.b1) = doi:10.5439/1615610
- KASACR
- Hemispherical RHI scan (corkasacrcfrhsrhiqcM1.b1) = doi:10.5439/1615605
- RHI sector scan (corkasacrcfrrhiqcM1.b1) = doi:10.5439/1615611
- PPI volume scan (corkasacrcfrppivqcM1.b1) = doi:10.5439/1615728
- KAZR
- General mode (corkazrcfrgeqcM1.b1) = doi:10.5439/1615726
- Moderate sensitivity mode (corkazrcfrmdqcM1.b1) = doi:10.5439/1615486
- XSACR
- Hemispherical RHI scan (corxsacrcfrhsrhiqcM1.b1) = doi:10.5439/1615727
- RHI sector scan (corxsacrcfrrhiqcM1.b1) = doi:10.5439/1616020
- PPI volume scan (corxsacrcfrppivqcM1.b1) = doi:10.5439/1615606.
Access the products now in the ARM Data Center. (Go here to request an account to download the data).
To share your experience with the data products or to ask questions, contact Hardin.
Follow Us:


Keep up with the Atmospheric Observer
Updates on ARM news, events, and opportunities delivered to your inbox
ARM User Profile
ARM welcomes users from all institutions and nations. A free ARM user account is needed to access ARM data.


