

How ARM Rang In the (New) Year of Open Science in the Rockies
Published: 14 February 2023
Editor’s note: In January 2023, the White House Office of Science and Technology Policy launched the Year of Open Science to advance national open science policies across the federal government. During the year, ARM is publishing a series of stories on work to advance open and equitable research. The following blog post is from Max Grover, a software developer at Argonne National Laboratory.
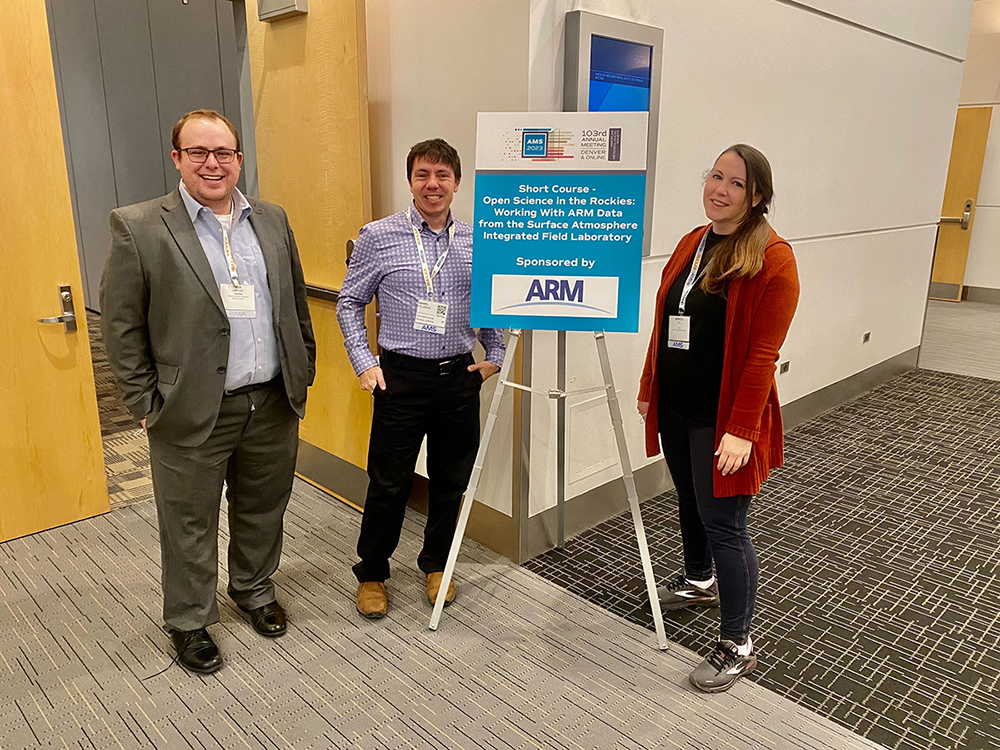
 Before the 103rd American Meteorological Society (AMS) Annual Meeting in January 2023, ARM organized the “Open Science in the Rockies: Working With ARM Data from the Surface Atmosphere Integrated Field Laboratory (SAIL)” short course. This daylong short course was the result of a collaboration between ARM field campaign scientists, data translators, and developers.
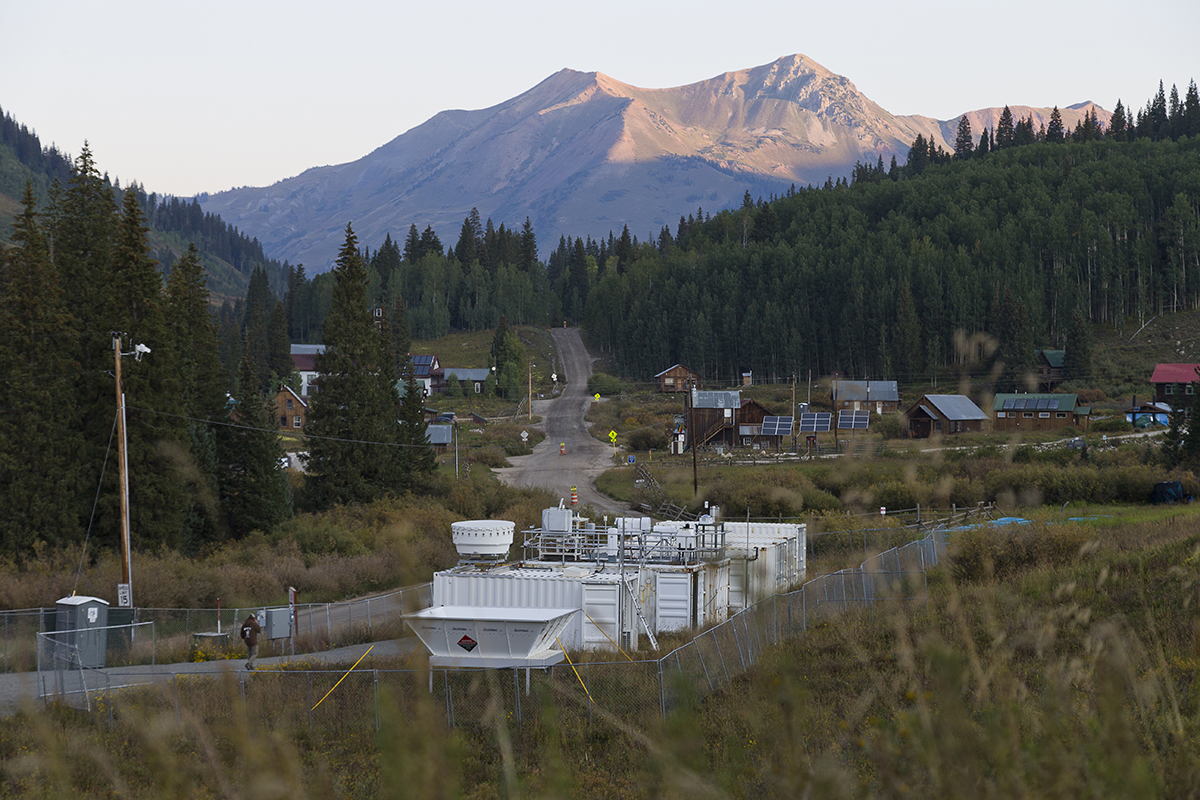
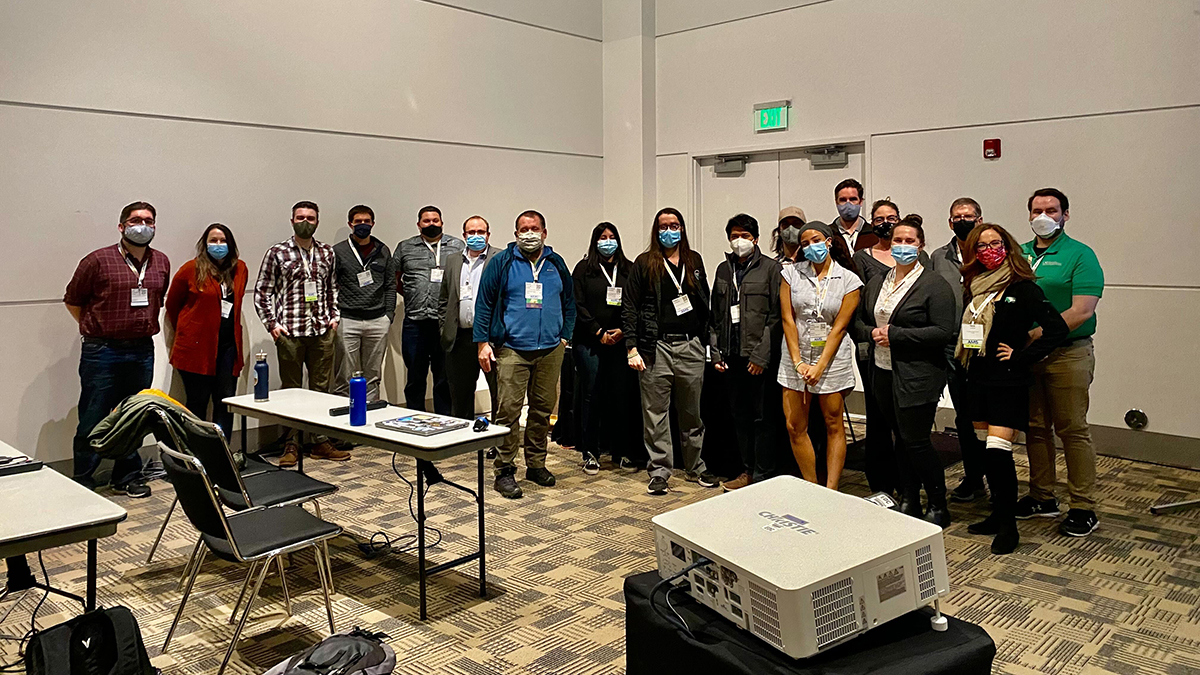
A total of 20 attendees included professors, research scientists, and graduate students, with a broad range of atmospheric science experiences and capabilities, all wanting to learn about the open science tools that ARM provides to work with data from the ongoing SAIL field campaign. SAIL is taking place near Crested Butte, Colorado, about a 4-hour drive from the AMS 2023 host city of Denver.
The short course was also a concrete example of the activities that ARM is supporting to advance its 10-year Decadal Vision by enabling open-source software practices to support the sharing of code among ARM staff and with the ARM user community.
Science Overview
The beginning of the workshop gave participants an overview of SAIL, the science objectives, and the instruments used during the campaign. Daniel Feldman, a scientist at Lawrence Berkeley National Laboratory and lead principal investigator of SAIL, provided this overview.
The ARM Mobile Facility (AMF) is just one of the observational platforms used for this campaign. The AMF hosts a suite of instruments collecting data to study precipitation and related atmospheric processes in the East River Watershed.
In the afternoon, Allison Aiken, an aerosol scientist at Los Alamos National Laboratory, lectured on aerosol measurements and initial results from the SAIL campaign.
The detailed background information on what aerosols are and why they are critical to understanding weather and climate processes complemented the technical skills taught in other parts of the workshop.
Participants also had an opportunity to ask Aiken questions about the instruments and how to analyze aerosol data from SAIL.
ARM’s Open Science Toolbox
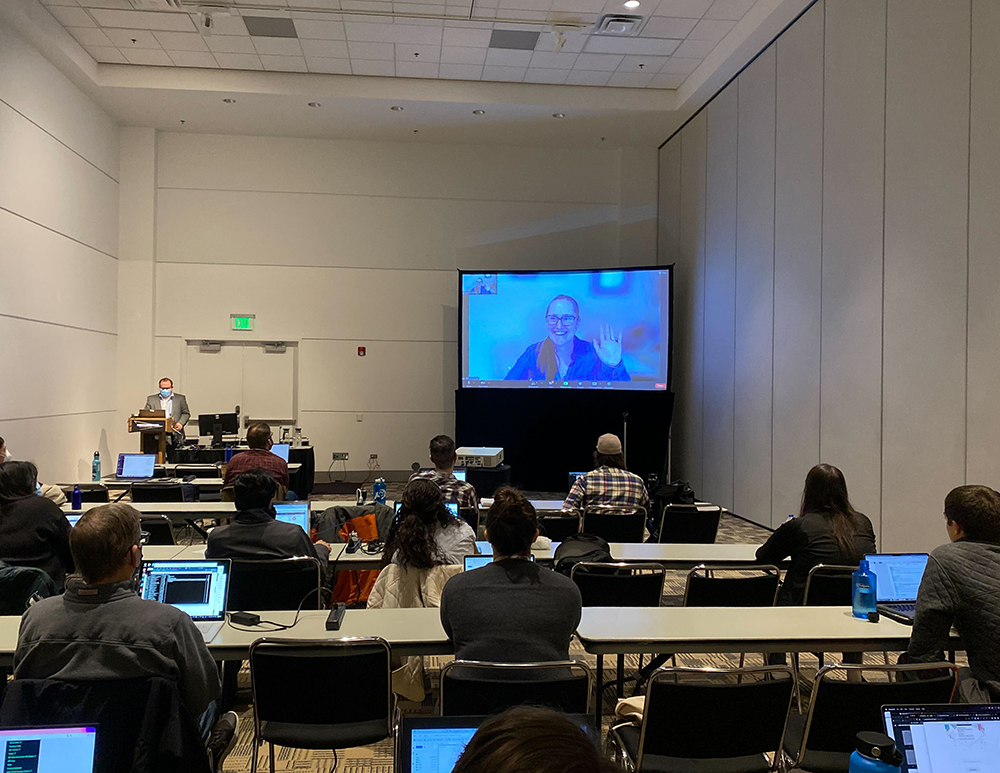
Following the science-focused discussion, attendees got started with a tutorial on ARM data and ARM’s open-source software tools. Monica Ihli, a data systems engineer at Oak Ridge National Laboratory, gave an overview of the ARM Data Discovery portal and an in-depth walk-through on how one would find their desired data set using this interface.
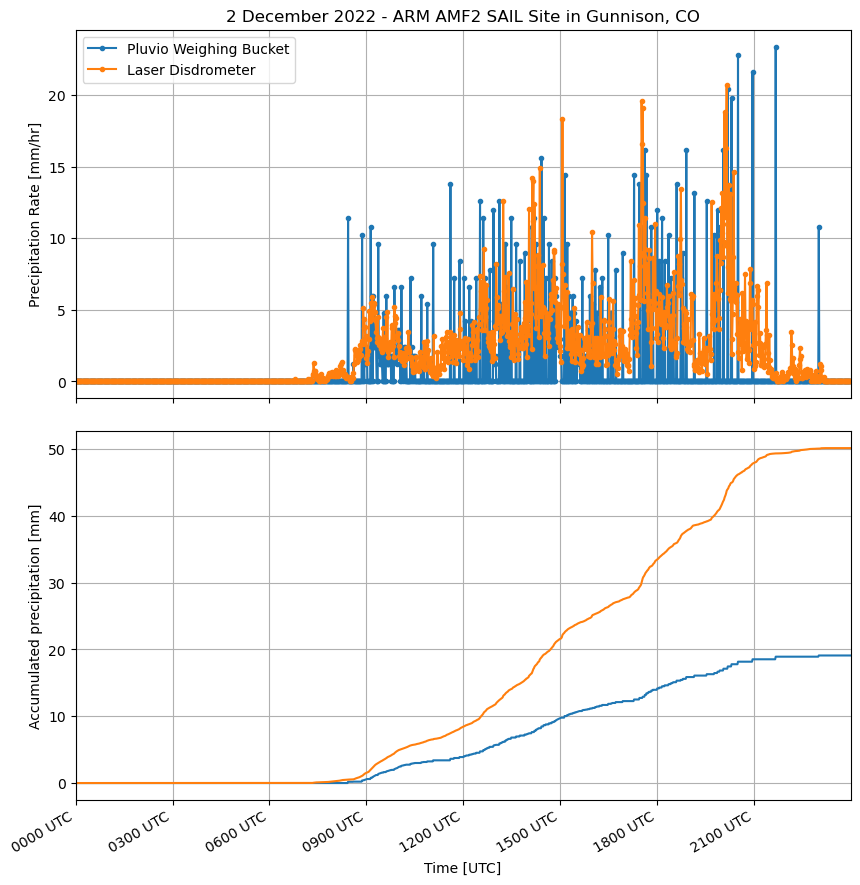
Once users downloaded their data sets, Max Grover, a software developer at Argonne National Laboratory, led a tutorial on the Python ARM Radar Toolkit (Py-ART). The X-band radar operating during the SAIL campaign provides information about precipitation processes, including snowfall. Students learned how to read in data, grid the data so they can be compared with models, and visualize the data sets.
Joe O’Brien, a software engineer from Argonne National Laboratory, gave an overview of the Atmospheric data Community Toolkit (ACT), which works with a broader collection of ARM’s instrumentation. Students downloaded data using the discovery module, applied corrections using the quality control functionality, and visualized the data using a collection of different displays.
Joining the Open Science Community
Scott Collis, a scientist at Argonne National Laboratory, closed out the short course by leading a tutorial on the GitHub software development platform, where ACT and Py-ART can be accessed, and explaining how it can be used for open science collaboration.
Ihli highlighted the different computational resources available from ARM, including JupyterHub, the online compute environment used for the course. She also walked students through how to request larger-scale resources, meant for intense computational research, on the ARM Cumulus high-performance computing cluster.
Survey Says …
“By the end of the day, I was able to start creating some preliminary figures to support some analysis for my own research.”
Lejo Flores, Boise State University professor and workshop participant
Feedback was collected after the course. Here are quotes from participants, responding to a prompt asking for their favorite part of the short course:
“I enjoyed learning about ARM’s open-source data tools as I was unaware of the Jupyter Notebooks that ARM hosts!”
“My favorite part was the coding tutorials. I have used Py-ART and Xarray in the past, but learned neat tricks that I am excited to use in the future. I had never heard of ACT before this workshop, so I am looking forward to experimenting with the module in my research. I am grateful for the technical support and expertise offered through the workshop.”
One of the attendees, Lejo Flores, a professor at Boise State University specializing in hydrology, shared the following reflection: “The Py-ART and ACT tutorials at AMS were outstanding. These are powerful tools to easily create analytical pipelines for not only SAIL data, but also a bunch of other ARM data (and more). By the end of the day, I was able to start creating some preliminary figures to support some analysis for my own research.”
Follow Us:


Keep up with the Atmospheric Observer
Updates on ARM news, events, and opportunities delivered to your inbox
ARM User Profile
ARM welcomes users from all institutions and nations. A free ARM user account is needed to access ARM data.


