

ACE-ENA Spotlight: High-Resolution Snapshots Help Solve Cloud Mysteries
Published: 12 August 2021
Editor’s note: Susanne Glienke, a postdoctoral research associate at Pacific Northwest National Laboratory (PNNL) in Washington state, worked on the Aerosol and Cloud Experiments in the Eastern North Atlantic (ACE-ENA) field campaign in the Azores. This campaign took place during summer 2017 (June to July) and winter 2018 (January to February). Glienke sent in this update on ACE-ENA research.

Warm marine clouds are arguably some of the easiest clouds to measure. These clouds are at a low altitude, making them relatively accessible, and liquid drops are relatively easy to detect and size. At the same time, they cover huge areas of the Earth for extended periods of time, which makes them important in a global context. As an example, a change in droplet sizes in marine clouds could lead to a change in global temperature, which shows just how important it is to accurately know the droplet sizes of existing clouds. And yet there are still unanswered questions, both due to the remoteness of the clouds over the ocean and limited measurement technologies.
ACE-ENA addressed the remoteness of clouds around the Azores by using the ARM Aerial Facility Gulfstream-159 (G-1) research aircraft. The campaign also addressed some important measurement limitations by using novel and well-established measurement techniques.
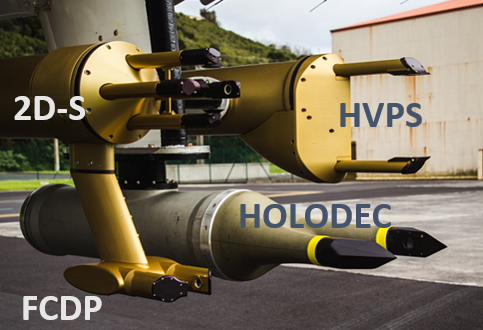
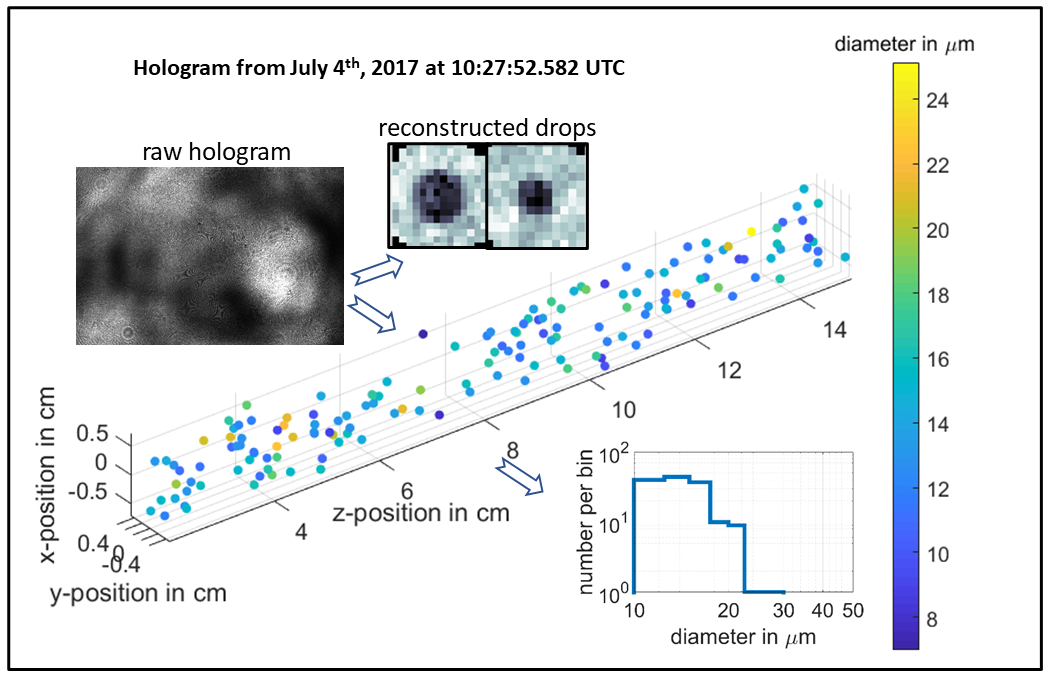
One novel technique for measuring cloud droplet size distributions is used by the holographic detector for clouds (HOLODEC, shown in Figure 1), a cloud probe I mentored as a graduate student during ACE-ENA. Instead of the more traditional approach of measuring one droplet at a time, HOLODEC takes a snapshot of a localized sample volume of about 13 cm3 and can determine a statistically relevant size distribution from this snapshot without averaging over long distances. At a measurement rate of 3.3 Hz and an aircraft speed of 100 m/s, this results in a localized size distribution about every 30 m. HOLODEC provides the three-dimensional (3D) locations of the droplets within the sample volume and gives two-dimensional (2D) images of the detected drops, as shown in Figure 2.
One challenge of HOLODEC is the huge amount of data (under a terabyte collected from each flight and easily doubled during processing) and the computational effort needed to obtain the size distributions. Initially, only a few days were processed and made available because of this limitation. Since then, as a postdoc at PNNL, I have increased the processing using extensive ARM computing resources. HOLODEC data from 15 of the 39 ACE-ENA flights are available now in the ARM Data Center, and more are coming soon; hopefully, the entire data set is completed within a matter of months. At the same time, there are ongoing efforts to improve the data quality.
This data set is extremely useful to determine cloud probe performance. HOLODEC can detect droplets in the size range of 6 to about 1,000 microns, which partially overlaps with the size range of other cloud probes. Most cloud probes deployed during ACE-ENA have a different size range, but we can compare and validate their measurements in the overlapping size range. If the instruments agree despite having different measurement techniques, it is more likely they all accurately capture reality, while a disagreement must be investigated further. Initial analysis shows quite good performance overall, with a few deviations under investigation.
Measuring local size distributions can help with understanding cloud microphysical processes. For example, the data from ACE-ENA have been used to examine turbulent entrainment mixing processes (Desai et al. 2021). In that case study, we determined the mean radius and number of droplets in each hologram, which can be used to determine the type of mixing within a cloud. Homogeneous mixing indicates that the entrained air—i.e., the clear, dry air mixed into the cloud—and cloudy air are mixed fast, and all droplets evaporate equally, whereas inhomogeneous mixing is slower and patchier, resulting in some droplets evaporating more than others. We found that the type of mixing differs with height, in this case with more inhomogeneous mixing close to the cloud top and homogeneous mixing at the cloud bottom.
Check out HOLODEC and other ACE-ENA data in the ARM Data Center.
Reference: Desai N, Y Liu, S Glienke, R Shaw, C Lu, J Wang, and S Gao. 2021. “Vertical variation of turbulent entrainment mixing processes in marine stratocumulus clouds using high resolution digital holography.” Journal of Geophysical Research: Atmospheres, 126(7), e2020JD033527, https://doi.org/10.1029/2020JD033527.
Follow Us:


Keep up with the Atmospheric Observer
Updates on ARM news, events, and opportunities delivered to your inbox
ARM User Profile
ARM welcomes users from all institutions and nations. A free ARM user account is needed to access ARM data.


