

ACE-ENA Spotlight: Measuring How Clouds Respond to Seasonal Aerosol Changes
Published: 17 August 2020
Editor’s note: This is the second entry in a blog series about ARM’s Aerosol and Cloud Experiments in the Eastern North Atlantic (ACE-ENA) field campaign, which took place during 2017 and 2018. Rob Wood, an ACE-ENA co-investigator from the University of Washington, shares a new set of findings from the air- and ground-based campaign.
Every spring, as the days lengthen and increasing sunlight reaches the midlatitude oceans, the abundance of marine life increases dramatically. At the base of the food chain, photosynthesizing ocean phytoplankton multiply using sunlight and dissolved carbon dioxide. One of the byproducts of the phytoplankton life cycle is a trace gas called dimethyl sulfide, which dissolves in the seawater and is released into the atmosphere. Although present in concentrations of only around 1 in 10 billion, dimethyl sulfide is a major player in Earth’s climate because of its outsized role in providing the nuclei upon which many cloud droplets form.
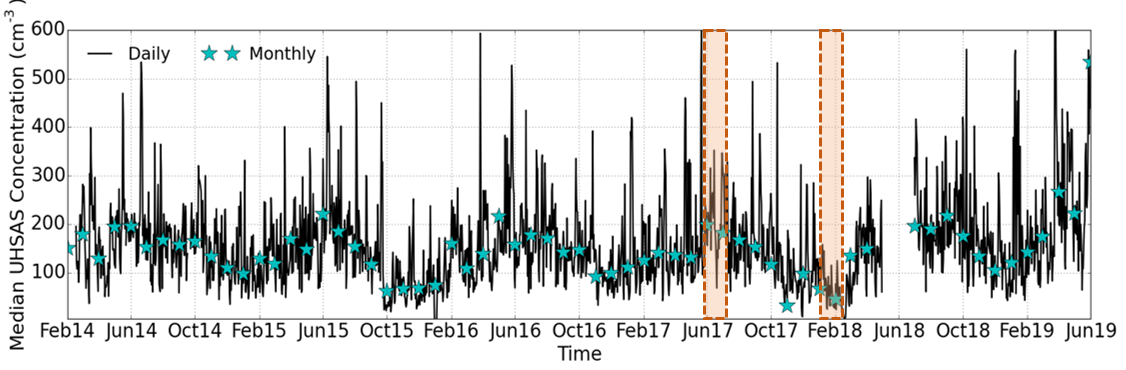
This seasonal awakening of the midlatitude oceans is seen in the concentration of aerosol particles with sizes of 0.1–1 micrometer at ARM’s Eastern North Atlantic (ENA) observatory on Graciosa Island (Figure 1). These particles form most of the cloud droplets in marine boundary-layer clouds at the ENA. Concentrations reach their peak in May–July each year and are roughly double those during the winter.
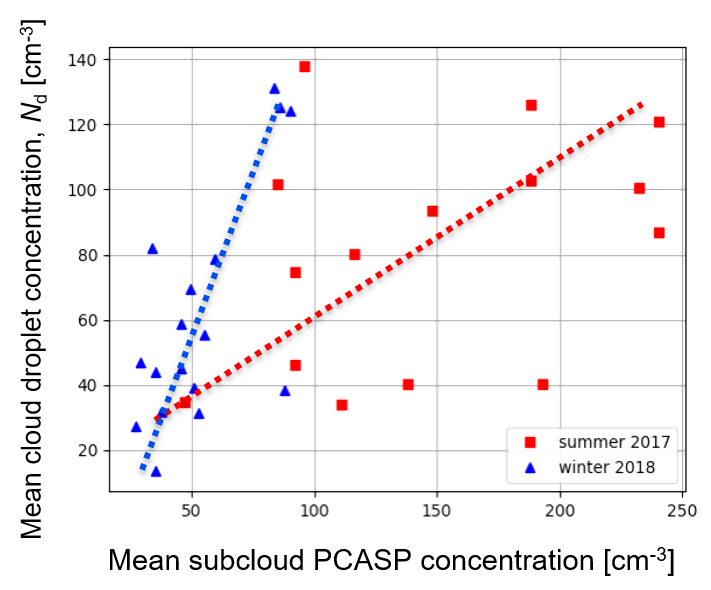
Using data from ARM’s Gulfstream-159 (G-1) aircraft, we find that the aerosol concentration at the surface is correlated with the concentration of droplets measured in the frequently occurring low clouds that cover the eastern North Atlantic. Figure 2 shows measurements for both the summer and winter seasons. The data show a tendency for higher cloud droplet concentrations (Nd) when there are more aerosol particles below cloud. This reflects the fact that every cloud droplet forms on a much smaller particle called a cloud condensation nucleus. The G-1 also made measurements of dimethyl sulfide (Zawadowicz et al. 2020) confirming the summertime maximum, and very low concentrations in winter of this aerosol precursor gas.
What is also very interesting is that Figure 2 shows a clear seasonal difference in the relationship between near-surface aerosol concentration and Nd. In winter, despite the lower aerosol concentrations, there is a stronger dependence—steeper slope—of Nd versus aerosol concentration measured with the passive cavity aerosol spectrometer probe (PCASP). This results in a seasonal cycle of Nd that is considerably weaker than the equivalent cycle in aerosol concentration.
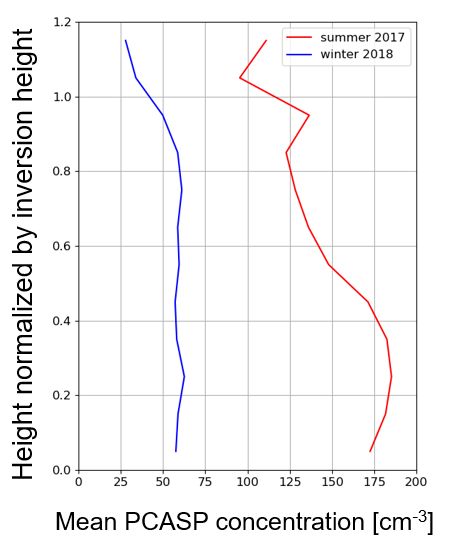
There are a couple of reasons for this. First, it has been found that updrafts in wintertime low clouds are stronger than summertime clouds on average, which means that a larger fraction of the aerosol can be activated to form cloud droplets. Second, the aircraft observations show that aerosol concentrations decrease with height more strongly in summer than during winter (Figure 3), which means that summertime clouds ingest lower aerosol concentrations than those measured at the surface.
These observations demonstrate the importance of using aircraft measurements, and they are being used to better understand the aerosol-cloud interactions in the atmospheric boundary layer and the unique role played by ocean biology.
We are currently running large-eddy simulations to model one of the summertime ACE-ENA cases (July 15, 2017) to understand processes controlling aerosol populations and their impacts on clouds.
Reference: Zawadowicz M, AK Suski, J Liu, M Pekour, J Fast, F Mei, A Sedlacek, S Springston, Y Wang, R Zaveri, R Wood, J Wang, and JE Shilling. 2020. “Aircraft measurements of aerosol and trace gas chemistry in the Eastern North Atlantic.” Manuscript to be submitted to Aerosol. Chem. Phys. Disc.
Read ACE-ENA Principal Investigator Jian Wang’s blog on aerosol findings from the campaign. Check back next month for a new blog post about ACE-ENA.
To access ACE-ENA data, log in to the ARM Data Center. (Go here to create an account to download the data.)
Follow Us:


Keep up with the Atmospheric Observer
Updates on ARM news, events, and opportunities delivered to your inbox
ARM User Profile
ARM welcomes users from all institutions and nations. A free ARM user account is needed to access ARM data.


