A 4-Dimensional View of Clouds
Published: 19 February 2019
Multiview stereophotogrammetry captures novel images of shallow clouds from all sides, generating unprecedented data sets

For scientists, quantifying the behavior of clouds—which are swift, ephemeral, chemically complex, and eccentrically shaped—is notoriously difficult.
As difficult as it is important. Clouds, after all, represent the biggest uncertainty in climate models.
In particular, shallow cumulus clouds critically influence the Earth’s radiation budget, but in ways that are not fully understood and that add to climate-model uncertainties.
One fact of cloud behavior is especially hard to pin down: At what speeds do clouds rise through the atmosphere? These so-called updraft speeds, from 1 to more than 10 meters per second (or 3.28 to 32.8 feet per second), are critical to determining cloud behavior. They affect precipitation, aerosol mixing, and even the rate of lightning strikes.
A new variation on an established measurement technology called stereophotogrammetry may help solve the updraft-speed puzzle. It’s being developed by a cloud science team at Lawrence Berkeley National Laboratory (LBNL) and the University of California, Berkeley.
Relevant data were gathered with help from the U.S. Department of Energy’s Atmospheric Radiation Measurement (ARM) user facility.
“I’m excited about the technology and what we can do with it,” says team leader David Romps, who has a joint LBNL-UC Berkeley appointment.
For ARM, stereophotogrammetry is already performing a much wider measurement role—most generally as a way of observing hard-to-quantify cloud boundaries in broken cloud fields. “Vertical motion of cloud top is one target,” says ARM Technical Director Jim Mather, “but by no means the only one.”
Early Beginnings
Scientists used stereophotogrammetry to study clouds more than a century ago, by using theodolites, rotating telescopes used to measure vertical and horizontal angles for surveying. (In one paper, Romps cites a study published in 1896.)
In the 1950s, researchers used analog photographs to get cloud positions and velocities. More recently, digital photography opened up the possibility of using feature-matching algorithms to automate the cloud reconstruction process.
Traditional stereophotogrammetry uses multiple cameras to create a three-dimensional (3D) model of an object or phenomenon—a cloud boundary, for instance. But making such models requires that the cameras are carefully calibrated, and that hundreds of recognizable points be matched between images in space—all by hand.

The LBNL-UC Berkeley team got around those laborious requirements by devising a novel combination of camera setup and calibration that avoids the need for landmarks, and by devising new algorithms that automate the reconstruction of passing clouds.
Romps says being free of the need for landmarks makes it even possible to create stereophotogrammetric models of clouds over the otherwise featureless ocean. That opens an entirely new door to investigating the behavior of marine clouds, which are themselves a source of uncertainty in climate models.
Going After a New Data Product
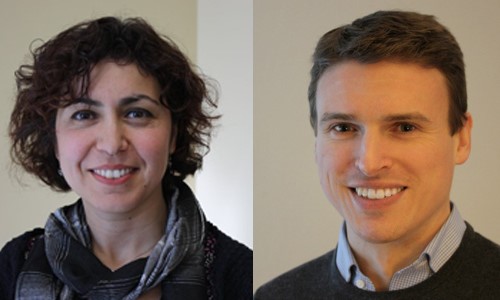
Romps and team member Rusen Öktem, a Berkeley project scientist, co-authored a 2018 paper in the Bulletin of the American Meteorological Society outlining their stereophotogrammetric innovation.
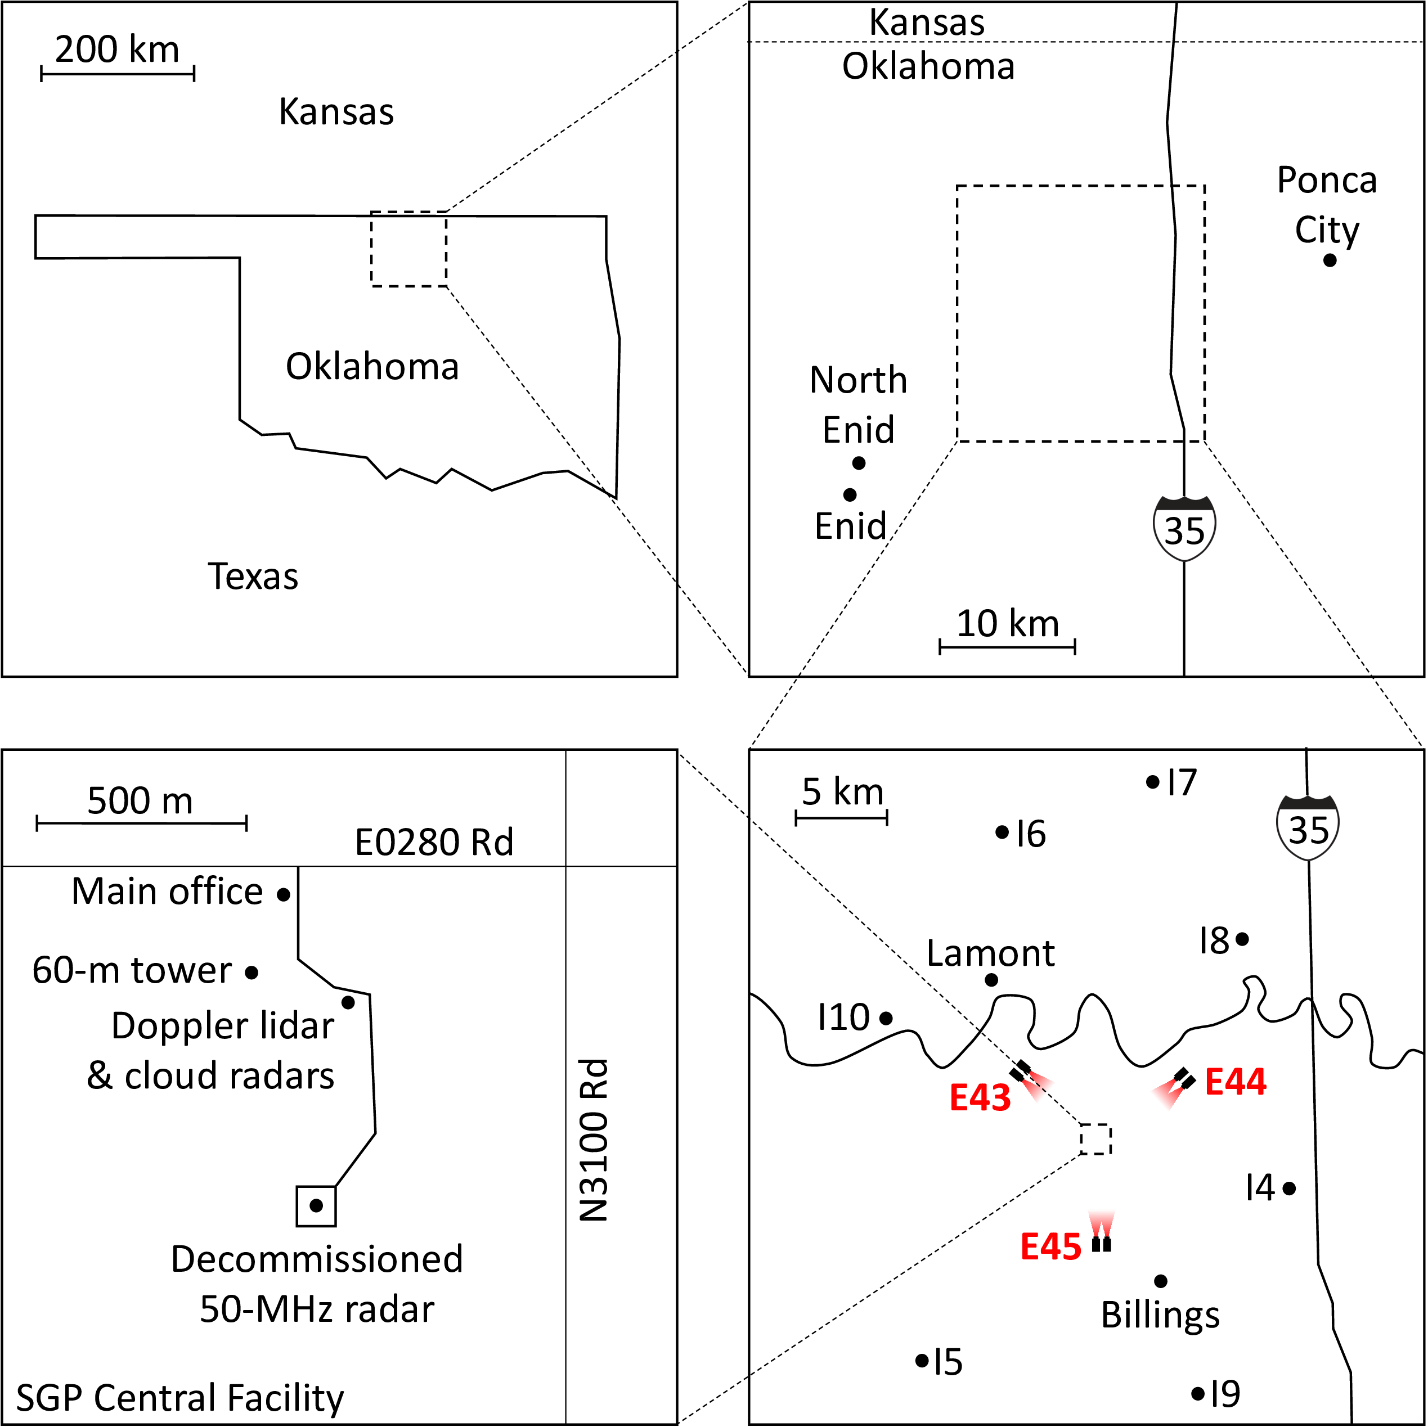
It was field-tested for years at ARM’s Southern Great Plains (SGP) atmospheric observatory, a 55,000-square-mile outdoor scientific laboratory in north-central Oklahoma and southern Kansas. Stereophotogrammetry has now been fully implemented on a permanent basis, says Mather, though “there is still work to be done to fully understand the technique’s potential.”
In their paper, Romps and Öktem describe a ring of six digital cameras—three pairs—installed in a triangular array, with the cameras in each pair 500 meters (1,640.4 feet) from each other. Together, the cameras provide a four-dimensional (4D) gridded stereoscopic view of shallow clouds from all sides.
The co-authors call the resulting data the Point Cloud of Cloud Points Product (PCCPP)—essentially a map of the physical locations of cloud boundaries observed by each pair of cameras.
From there the data are processed into the Clouds Optically Gridded by Stereo (COGS) product. The COGS data provide a 4D grid of cloud boundaries—cloud edges—observed by the six cameras. Each grid covers a cube of space 6 kilometers (3.7 miles) on each side, with space and time resolutions that are impressively fine: 50 meters (164 feet) and 20 seconds, respectively.
This is the “unprecedented” data set Romps and Öktem write about in their paper—data that promise to provide new insight into the sizes, lifetimes, and life cycles of shallow cumulus clouds.
Most of the COGS data volume is in the images themselves, collected every 20 seconds. In the past year, that’s about 2 terabytes of data in images alone, with each image from each of the six cameras coming in at about 250 kilobytes. “Not huge,” says Romps of the yearly total, “though it wouldn’t fit on my laptop.”
Those data represent a step toward more accurate parameterizations and theories of shallow cloud cover. COGS will allow scientists to get a better idea of real-world cloud updraft speeds, horizontal sizes, elevations, depths, and the rates at which clouds dissipate.
In recent decades, researchers have deployed scanning cloud radars in search of these same data. But the resulting measurements have spatial and temporal resolutions too coarse to capture the true sizes and lifetimes of shallow cumuli. They also have limited sensitivity to clouds with very small drops, such as those common in shallow cumulus clouds over land.

Romps and his team employ small, low-cost consumer digital cameras that offer essentially unlimited temporal resolution and can have a spatial resolution as fine as 50 meters (164 feet) for objects as far away as 30 kilometers (18.6 miles).
In their paper, Romps and Öktem write that taking advantage of such high-performance, low-cost cameras will “virtually guarantee that photogrammetry (measurement using photographs) will be a staple of atmospheric observation in the days to come.”
Meanwhile, cautions Mather, “radars and other remote sensors provide critical quantitative information that the cameras don’t, like information about droplet size and water content.”
In the end, he adds, “the two systems complement each other very well.”
First, the Ocean
The origin of the LBNL-UC Berkeley stereophotogrammetry project dates to a 2008 visit Romps made to Mexico’s Yucatan Peninsula.
He challenged himself to get estimates of cloud-top vertical velocities by holding a thumb out at arm’s length and counting off seconds. (The width of a thumb, he says, can be converted to meters.) The fast-moving updrafts, Romps calculates, were ascending at around 10 meters (32.8 feet) per second.
The idea got a research-grade tryout in April 2013 in southern Florida. Romps and others calibrated a pair of cameras set at a distance from each other and pointed them at clouds over Biscayne Bay, where there are no landmarks.
One camera was set up at a public high school, and the other at the University of Miami. The experiment was described in a 2014 paper led by Öktem, with Romps as the senior author.
The team devised algorithms to automate what was then 3D reconstruction of cloud life cycles, then compared the accuracy of its results to lidar and radiosonde data. The result, the paper states, was “good agreement.”
The Florida study presented a promising way to perform stereophotogrammetry of clouds over the open ocean. It also led to refining the experiment by using cameras emplaced at the SGP, with the hopes of gathering long-term data on the shallow cumulus clouds so prevalent there.
“We have six cameras up and running continuously,” says Romps. “At least in the near term, we will continue to focus on the SGP site. We have a full year’s worth of data to look at already, so we’re quite busy.”
He says his team has papers underway related to how the observed clouds dissipate and how to estimate the internal circulation of clouds.
In the Field, for the Models

At the SGP, Romps and his team started small, by installing a single pair of LBNL-owned cameras in 2014, each facing west and spaced 700 meters (2,296.5 feet) apart. Together, the digital cameras reconstruct cloud points in a cone of space 2 kilometers (1.2 miles) west of the heavily instrumented SGP Central Facility. They cannot reconstruct clouds over the Central Facility itself.
To that end, the LBNL-UC Berkeley team emplaced their six-camera, three-pair ring configuration. It was officially turned on August 31, 2017.
In that way, says Romps, “the reconstruction volume (of clouds) actually sits over the Central Facility. The instruments there—radar, lidar, and radiometers—can be looking at the same clouds we are.”
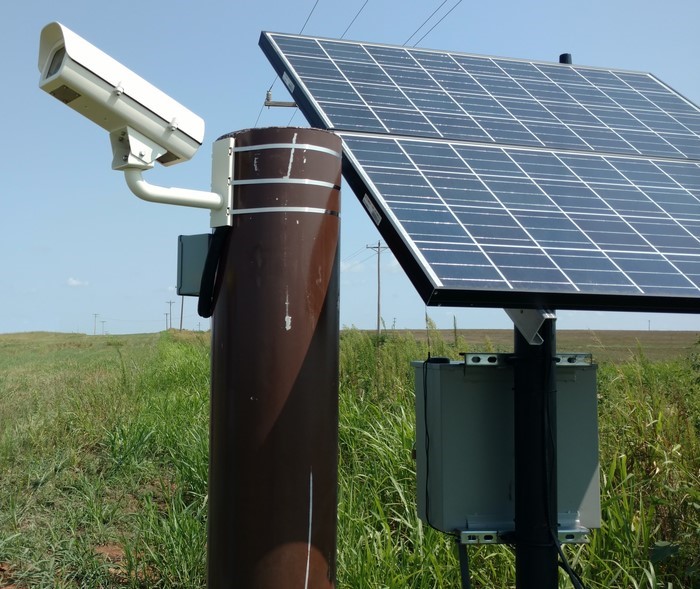
In the field at the SGP, the small stereo cameras in the new array run off solar power and communicate through cellular networks.
“They are really standalone things you can plop down in someone’s field,” says Romps. “Every once in a while they move, they get kicked by something—a cow that came by—but that’s not a deal-breaker for us. We have this (automated algorithm) we’ve developed to recalculate and keep on trucking.”
Romps and his team are particularly interested in how clouds decay as they drift through the field of view created by the three-point array of stereo cameras.
In an ideal world, “some beautiful code” could see “elegantly and objectively” what the clouds are doing as they merge or break apart, he says. “But it’s impossible to write code like that without getting an intuition about what is happening.”
For that reason, the Romps team looks at a lot of videos from the SGP installation to help refine its algorithms.
‘Critical Information’
In a timelapse video from June 11, 2016, assembled by Öktem, hundreds of complex puffy clouds race overhead on a sunny day at the SGP. It’s a vivid reminder of the complex dynamics at play as clouds are emplaced in the sky and then decay. Video is courtesy of Romps.
The pair of cameras installed in 2014 was the centerpiece of a field experiment that has been extended.
ARM owns the ring array of stereo cameras installed in 2017 at the SGP, as well as a pair of cameras now deployed in Argentina through April 2019 during an ARM convective clouds campaign called Cloud, Aerosol, and Complex Terrain Interactions (CACTI).
CACTI marks the first use of the stereo cameras as part of the ARM Mobile Facilities, a series of portable observatories deployed worldwide.
“Quite likely, we will participate in other campaigns,” says Romps, who even imagines a day when every weather station will have a pair of such cameras. “If you need to know what clouds are doing, even shallow clouds, this is valuable data.”
The stereophotogrammetry work at the SGP and elsewhere is another step toward what Romps calls “the reason I do what I do”—to track and measure clouds over their life cycles as a way of improving models.
Meanwhile, in the skies over the SGP Central Facility, “we’re getting quantitative data on a whole slew of clouds as they’re evolving,” says Romps. “It’s just critical information.”
Keep up with the Atmospheric Observer
Updates on ARM news, events, and opportunities delivered to your inbox
ARM User Profile
ARM welcomes users from all institutions and nations. A free ARM user account is needed to access ARM data.


