

BAMS Article Reports on a Data-Rich ARM/NASA Storm Clouds Campaign
Published: 20 June 2016
Midlatitude Continental Convective Clouds Experiment to be published in upcoming edition
Convective clouds distribute water, heat, and momentum throughout the lowest layer of the Earth’s atmosphere, where weather happens. They get their name from the convective motion prompted when the surface of the Earth heats up, causing air to become buoyant and rise into the atmosphere.
With vast stores of deep moisture within these cloud systems, “they’re the ones that really drive thunderstorms and squall lines and the type of severe weather events that we’re very interested in knowing more about,” said Michael Jensen, a Brookhaven National Laboratory meteorologist. Convective clouds are also an important player in the Earth’s climate regime, he said, but one that climate models are still struggling to accurately represent and predict.
To improve our understanding of convective clouds and the dynamic environments they create, Jensen—a 20-year ARM science veteran—and other researchers designed a field campaign to gather data on the life cycles of severe-storm cloud systems. With storm-wracked south-central Oklahoma as an open-air laboratory, a joint research enterprise unfolded during six weeks in April and May of 2011. The Midlatitude Continental Convective Clouds Experiment (MC3E) involved the U.S. Department of Energy’s ARM Climate Research Facility and the NASA Global Precipitation Measurement (GPM) satellite mission.
Jensen was lead author of a paper in a Early Online Release (December 18, 2015) of the Bulletin of the American Meteorological Society (BAMS). It outlined the mission of MC3E: To improve current predictive modeling by gathering comprehensive data during a variety of weather conditions over a long interval of time.
The experiment deployed an array of ground, sky, and space instrumentation in a Midwestern region of the continental United States where severe storms are seasonally common. The experiment captured data meant to characterize convective storms. Five years later, data sets from the MC3E campaign have already generated 40 scientific papers.
“There will be a long tail on this number,” said Jensen, who just compiled a bibliography of MC3E published work. “At the 10-year mark, there will still be scientists working with that data. It’s a rich data set.”
Complex Physics of Convective Clouds
The heavy influence of convective clouds on both regional weather and global climate make them important to know more about. Understanding them better will help ground- and satellite-based sensing instruments accurately predict, monitor, and estimate the precipitation that convective cloud systems cause over continental-scale land masses. Knowing more will also improve numerical simulations of the physics of convective clouds.
But getting accurate representations of those cloud physics in weather and global climate models is still a challenge, especially regarding estimates of precipitation.
“We need to understand more about them,” said Jensen of climate-affecting convective clouds, even though climate models have improved. “There’s a lot more to look at.”
The MC3E experiment was conducted during April and May 2011. Researchers investigated several dimensions of convective storms: Their vertical structure, air motions, ice properties, and the drop size of the precipitation they create, including how that precipitation was distributed. They also tried to estimate the accuracy of space-based estimates of rainfall over land.
To get better simulations of cloud and land surfaces during storms, the researchers measured the vertical and horizontal heat and pressure structures that shape storms. To study convective cloud life cycles, they measured cloud and precipitation variability through land- and aircraft-based remote sensing. And they measured the updraft and downdraft dynamics within storm clouds, and how they related to the lower atmosphere.
Above, Within, and Below Storm Clouds
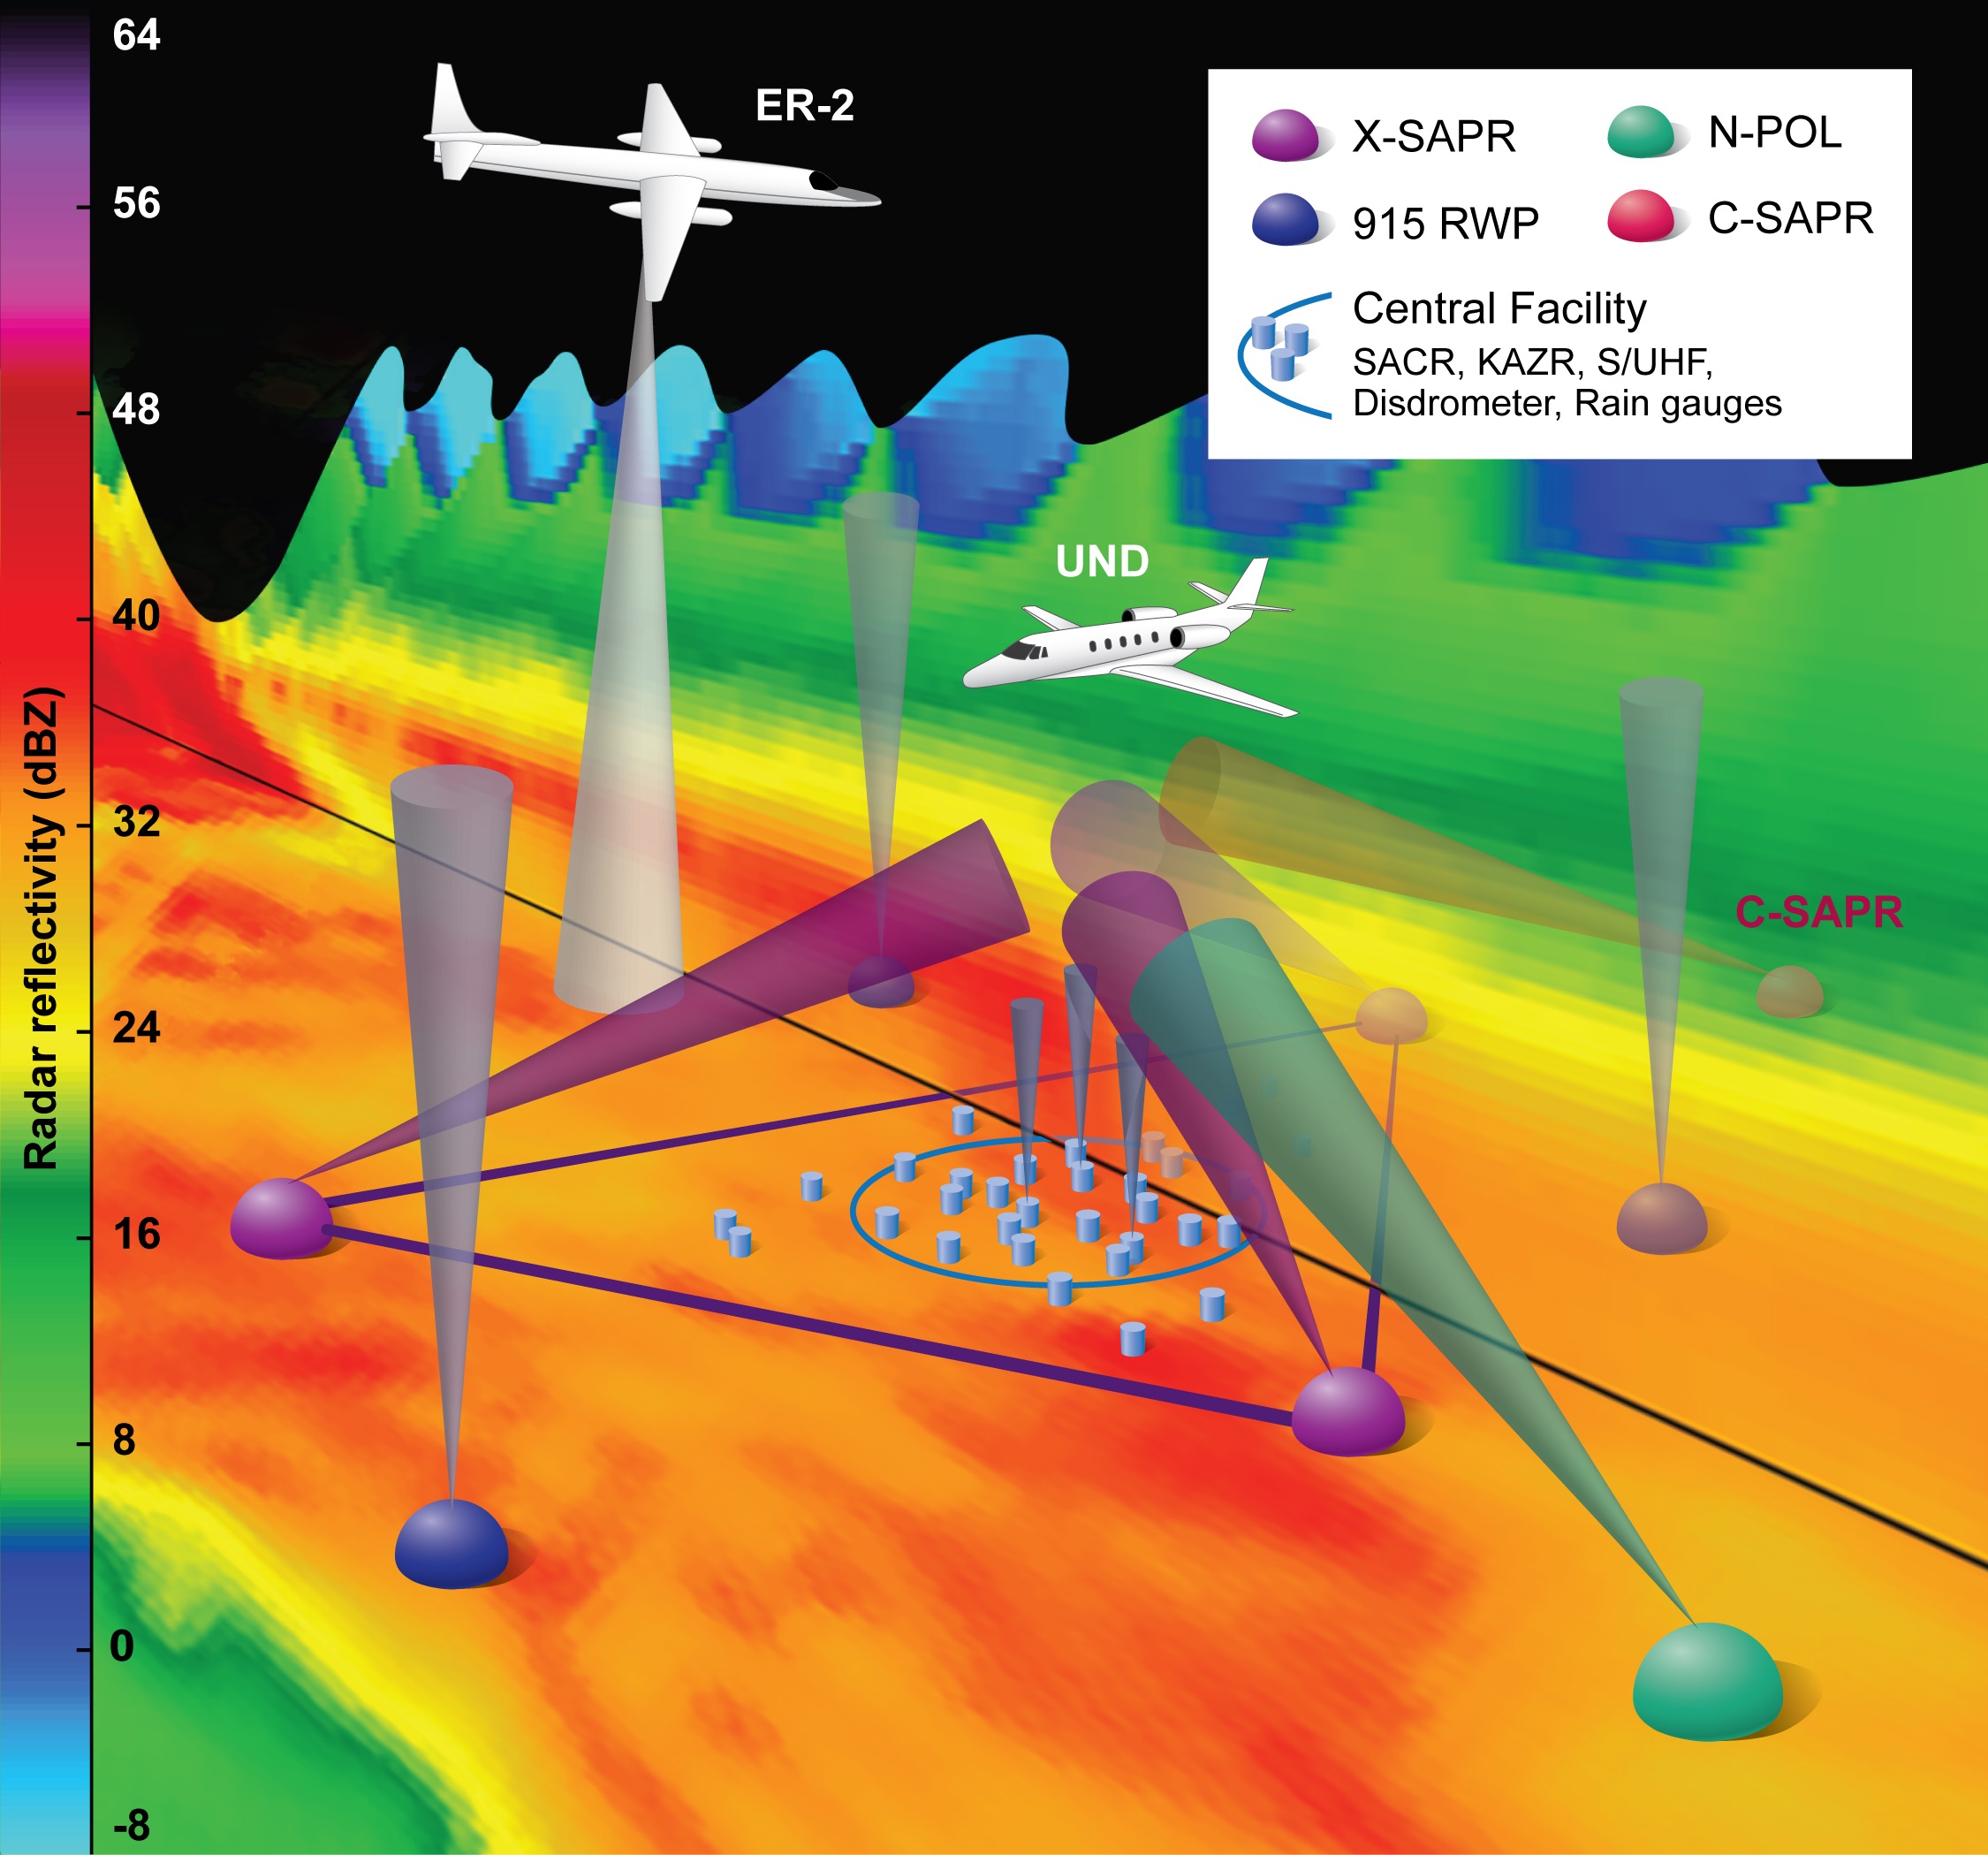
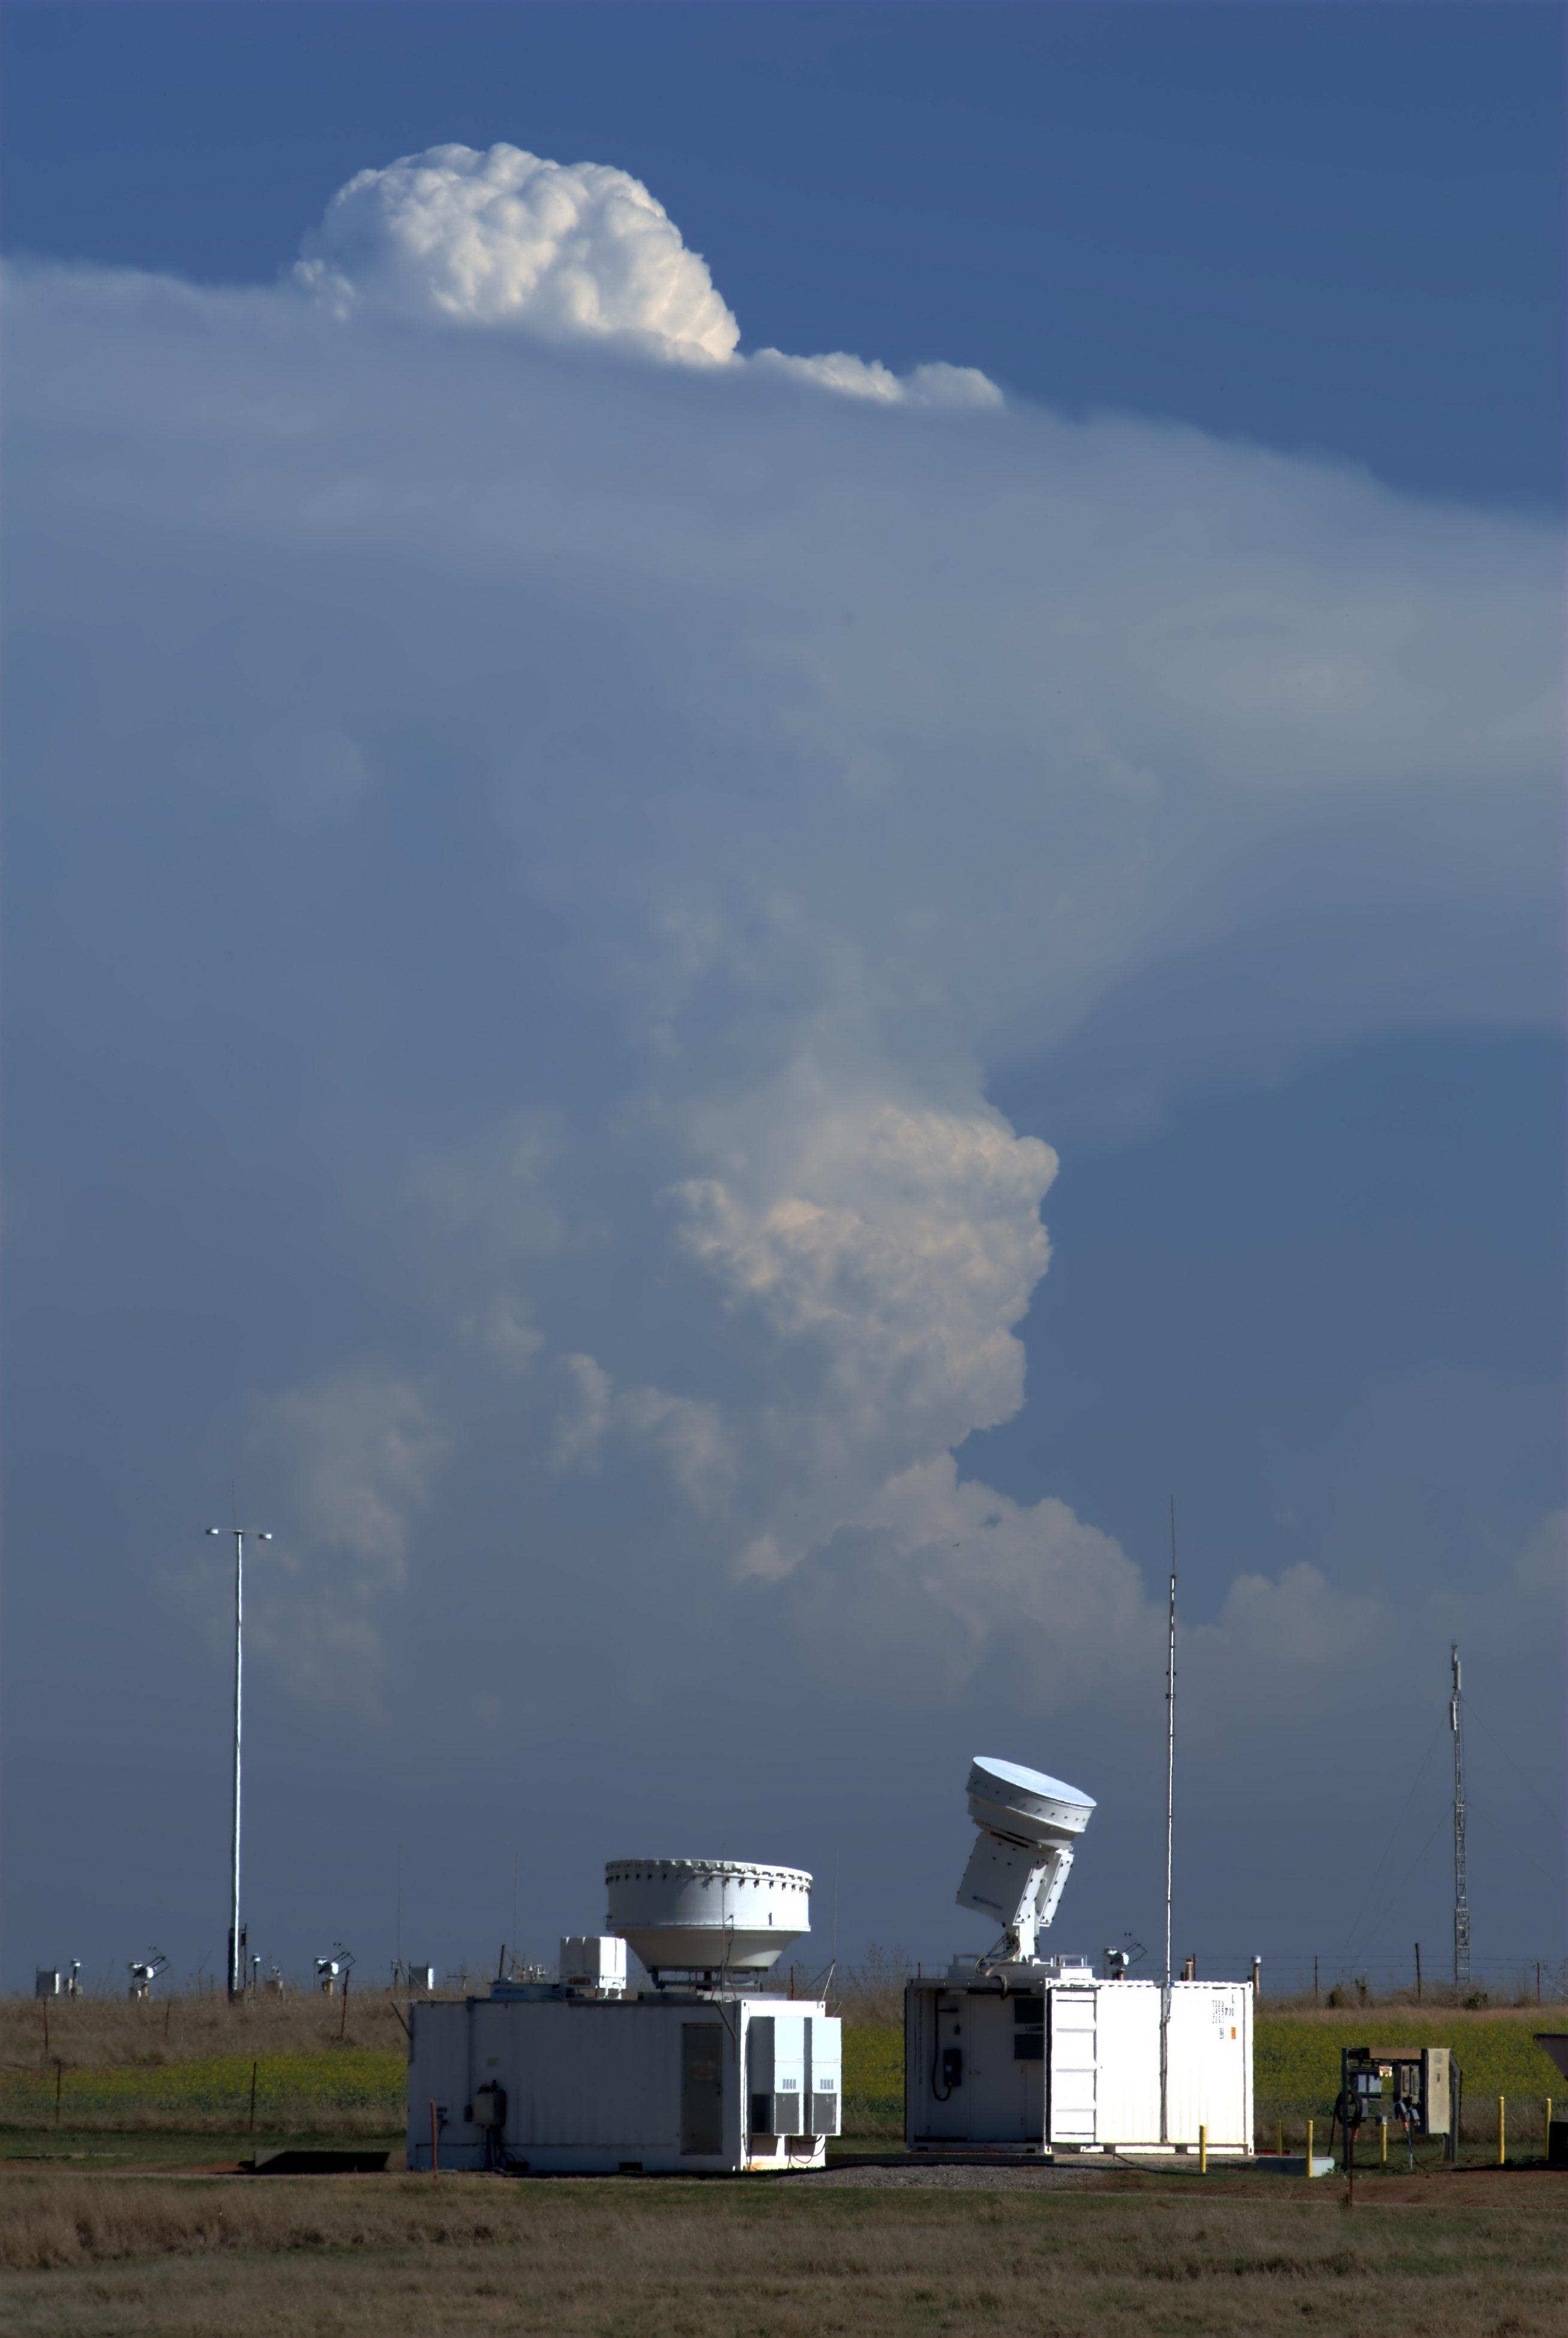
Such measurements required instrumentation on the ground, air, and in space. MC3E used the data-gathering capabilities of the Southern Great Plains (SGP) site, ARM’s first climate research facility, which has the largest ground-based measurement infrastructure in the world. The experiment also used additional in situ radar and precipitation measurement tools.
During aircraft observations and data gathering, three different vantage points were at work: A downward view by NASA’s ER-2 high altitude aircraft, which during 73 hours in the air executed 14 flights and carried instrumentation similar to the GPM core satellite; an inside view by a University of North Dakota Cessna Citation jet, a cloud-penetrating aircraft; and a ground-based upward view of precipitation within the cloud column from the ARM Facility.
In use on the ground were a number of radars, four ARM wind profilers, and a network of rain gauges and disdrometers that measured the rainfall amount and raindrop sizes. SGP assets included the Central Facility and, at the time, 20 extended facilities throughout an area of 150 km x 150 km. These were used to measure variations in surface heat, moisture, and momentum fluxes across the region of study. Weather balloon instruments measured temperature, humidity, and wind across the study region. Balloons were launched from six sites four times a day, and eight times a day when storms threatened: 1,348 launches in all.
Every morning for six weeks, the scientists on site gathered for a weather briefing. The designated lead scientist of the day would decide on what activities needed to be carried out by the aircraft, balloons, and other instrumentation platforms. Despite the research setting—wind, rain, and lightning—researchers spent most days indoors monitoring computer outputs and radar images.
By the end, MC3E had assembled one of the most complete data sets ever for convective cloud systems and their elusive, dynamic, and climate-critical environments.
“The research,” said Jensen, “will continue.”
To learn more about the study, read this ARM research highlight or MC3E: A Legacy of Learning article.
# # #
The ARM Climate Research Facility is a national scientific user facility funded through the U.S. Department of Energy’s Office of Science. The ARM Facility is operated by nine Department of Energy national laboratories, including Brookhaven National Laboratory and Argonne National Laboratory. Argonne operates the Southern Great Plains megasite.
The ARM Climate Research Facility is a DOE Office of Science user facility. The ARM Facility is operated by nine DOE national laboratories, including .
Follow Us:


Keep up with the Atmospheric Observer
Updates on ARM news, events, and opportunities delivered to your inbox
ARM User Profile
ARM welcomes users from all institutions and nations. A free ARM user account is needed to access ARM data.


