

DOE-funded Experiment Corrects Way Turbulent Eddies Calculate
Published: 13 July 2017
A recent research letter overturns an 80-year-old assumption
In 1913, a young University of Cambridge graduate named Geoffrey Ingram Taylor was a meteorologist aboard the Scotia, an ice patrol vessel deemed necessary after the sinking of the Titanic. Far out in the North Atlantic, he confronted the physics puzzle of turbulence in the atmosphere, which fell in line with his already keen interests in light diffraction, shock waves, and the turbulent motion of fluids.
Among the fruits of the long career that followed, Taylor published his frozen turbulence hypothesis in 1938. It holds that energy changes within turbulent eddies (circular currents that run counter to main currents) are negligible since they appear “frozen” as they advect—move horizontally—past sensors.
Since then, the assumption has been that eddies retain their shape as they swirl close to the surface, no matter what their size. This perceived given underlies the eddy covariance method, a key statistical technique used by modelers to account for the energy and gases within these chaotic eddies. Scientists need such accounting in order to estimate the Earth’s energy budget, which also includes land-atmosphere exchanges of heat and water.
A Better Way to Flux Data
A recent article in Geophysical Research Letters demonstrates what the authors call the “failure” of this nearly 80-year-old method to accurately inform global flux data sets, and therefore to correctly simulate the energy balance between the Earth’s surface layer and its atmosphere.
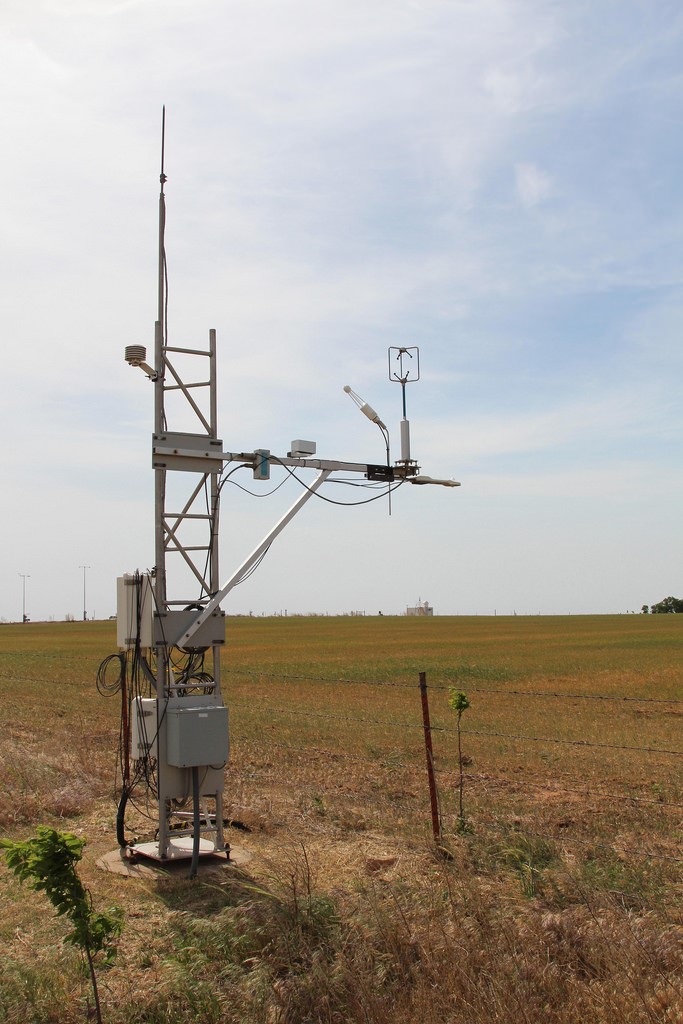
Typically, eddy flux data are collected from thousands of instrumented towers around the world. They measure humidity, wind, and net gas exchanges between the atmosphere and terrestrial ecosystems.
The researchers, led by Columbia University associate professor Pierre Gentine and doctoral student Yu Cheng, maintain that today’s flux data sets underestimate the energy in eddies by anywhere from 10 to 30 percent.
In order to shrink the errors in such data sets, the researchers describe a correction factor they say will improve the accuracy of models. They also maintain the factor should be applied to all present global flux data sets.
Cheng and Gentine wrote the letter based on a 2016 experiment that was in part funded by an early career grant from the U.S. Department of Energy (DOE). Joining them in the research were collaborators from Oklahoma State University, Oregon State University, and the University of Oklahoma.
The researchers analyzed data from the field experiment, conducted at the Oklahoma State University Range Research Station site, and concluded that smaller eddies move more slowly than larger ones. They do not “freeze” into the easy-to-measure shapes of a steady breeze, but instead they dissipate, losing energy along the way.
“Small eddies actually differ,” said Cheng, and that means energy variances are not being accounted for in present models, which rely on Taylor’s decades-old hypothesis.
Turbulence Fluxes, Truly
In the field, the researchers demonstrated the utility of getting better spatial data, which they surmised was needed to capture the true nature of turbulence fluxes at the Earth’s surface. It’s a matter of “how they are distributed in space and time,” said lead author Cheng, who helped craft the nine-page letter’s complex wave, velocity, and temperature schematics. “To capture these surface fluxes is a very hard question because wind is turbulent.”
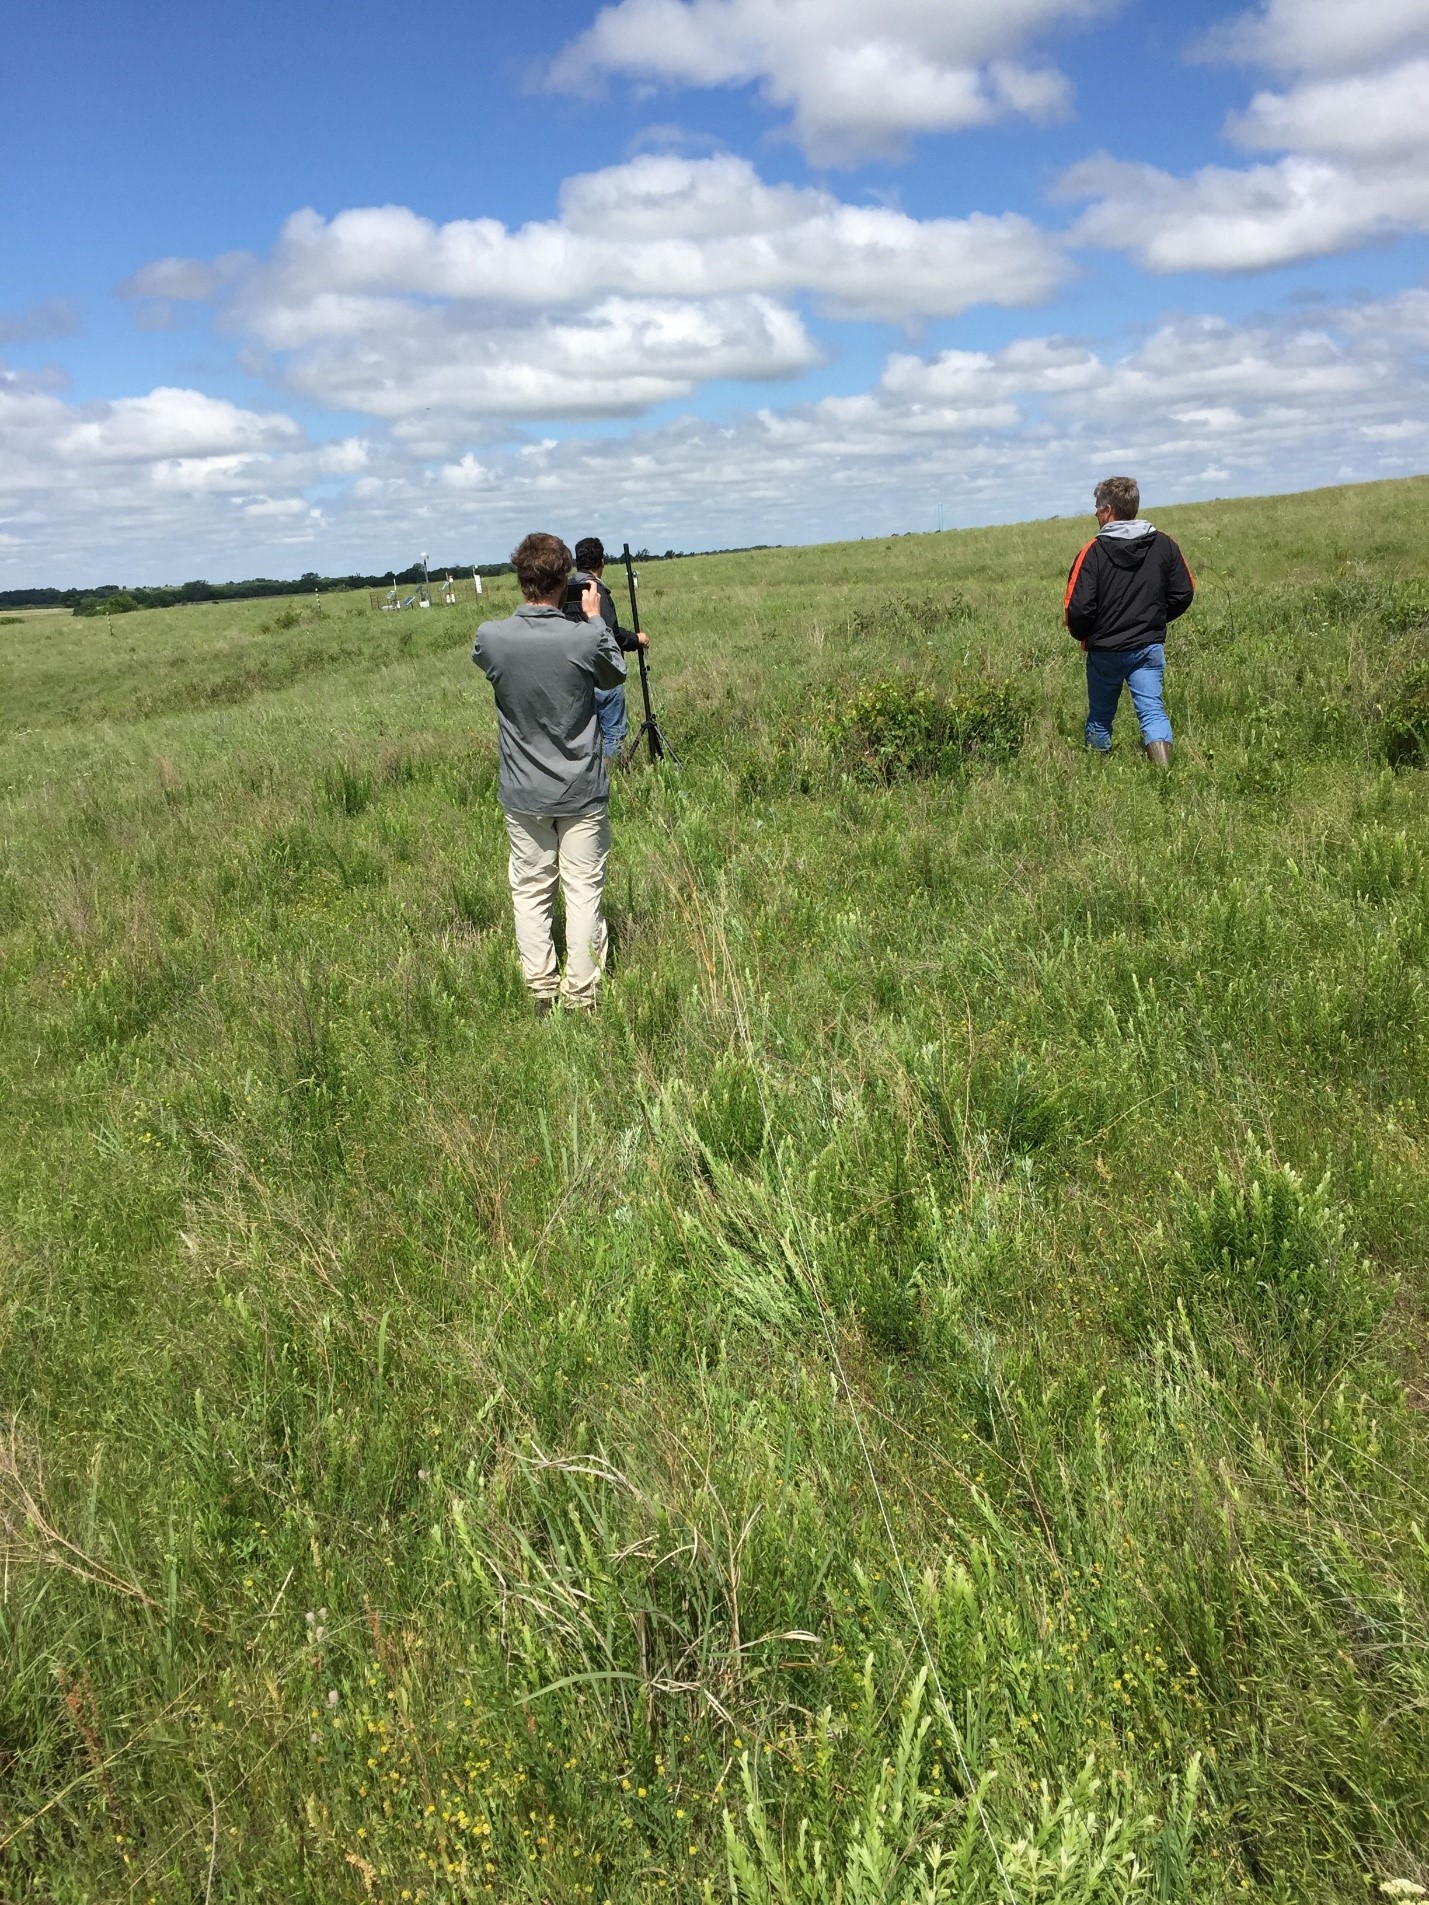
At the Oklahoma State field site, Gentine and others set up an array of fiber optic sensing cables at four different heights (from 1 to 1.75 meters). They were helped by ARM staff from the DOE’s Southern Great Plains (SGP) atmospheric observatory in Oklahoma.
The resulting transect was 233 meters long, supported by tripods, and precisely weighted in order to maintain a constant tension during the experiment’s nearly two months. The cables were finely tuned, picking up changes in temperature from eddies every 0.127 meters and in intervals of 1.5 seconds.
The upstart research letter nabbed the attention of the Earth and space science magazine Eos, a publication of the American Geophysical Union, which published a related feature in June.
Data, available now through the Gentine Lab at Columbia, will be shared with the DOE’s Atmospheric Radiation Measurement (ARM) Climate Research Facility, said Cheng.
ARM oversees SGP and other fixed and mobile atmospheric observatories across the world. Its long-term archive for atmospheric data has been in place for 25 years.
In the next stage of research activities this summer, during the Cross-Scale Land-Atmosphere Experiment, Gentine will deploy an even longer set of fiber optics cables at ARM’s SGP observatory in order to study larger eddies than could be observed with the initial experiment.
The ARM Climate Research Facility is a DOE Office of Science user facility. The ARM Facility is operated by nine DOE national laboratories.
Follow Us:


Keep up with the Atmospheric Observer
Updates on ARM news, events, and opportunities delivered to your inbox
ARM User Profile
ARM welcomes users from all institutions and nations. A free ARM user account is needed to access ARM data.


