Welcome to the Matrix
Published: 10 August 2011
Overhaul of Data System Status Viewer Hits Bull’s-eye

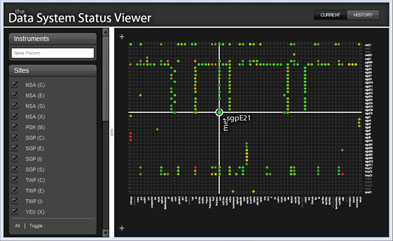
How do you display the operational status of nearly 200 instruments at multiple sites around the world on a single web page? In late June, ARM implemented a major system overhaul of the Data System Status Viewer, or DSView—the interactive database providing operational status information for every instrument at ARM’s permanent sites. Now running with Adobe®Flash® software, the complex grid is surprisingly easy to navigate. Using a “bulls-eye” to guide the viewer to the desired instrument and site, the new display also includes:
- a filterable status grid showing the current status of all data system processes
- a filterable set of visual timelines indicating the history of status changes over time
- the ability to export status reports to Excel format
- the ability to browse processing logs.
Initially developed in 2001, the first DSView interface served admirably for nearly a decade, until its aging software began to introduce system vulnerabilities and limit expansion capabilities. A replacement system developed in 2009 provided additional features, but proved difficult to deploy and maintain across the ARM sites and had slower performance than desired. In defining requirements for an improved tool, software engineers at the ARM Data Management Facility focused on a “lightweight” system that sacrificed little-used options in favor of features needed most by operations staff.
The latest installment of DSView has a totally different look and feel than previous versions, is much faster, and is easily deployed and installed—each site has its own DSView web page displaying only site-relevant information. Because collection, time check, and ingest processes run on both the site and DMF systems, this allows for quick and helpful comparisons. In updating the grid to an integrated process/data view, the display is refreshed every five minutes while content in the database history is used to display a timeline view of cumulative changes to detect intermittent events.
The ARM Climate Research Facility is a DOE Office of Science user facility. The ARM Facility is operated by nine DOE national laboratories, including .
Keep up with the Atmospheric Observer
Updates on ARM news, events, and opportunities delivered to your inbox
ARM User Profile
ARM welcomes users from all institutions and nations. A free ARM user account is needed to access ARM data.


