

New VAP Maps Scanning ARM Precipitation Radar Data to Cartesian Grid
Published: 21 June 2020
The Corrected Moments in Antenna Coordinates Version 2 (CMAC2) value-added product (VAP) corrects raw precipitation radar data and retrieves precipitation quantities from the measurements. A new evaluation VAP, Mapped Moments to a Cartesian Grid (MMCG), allows users to analyze CMAC2 data in Cartesian coordinates instead of antenna coordinates.
The Atmospheric Radiation Measurement (ARM) user facility’s scanning precipitation radars produce measurements of raw radar moments in coordinates of the antenna’s azimuth and elevation as well as distance from the radar. However, most numerical representations of the atmosphere tend to be in a Cartesian coordinate system using either height above mean sea level or in sigma or pressure coordinates.
Objective analysis (OA) is a method of mapping unstructured data to a structured grid. In the context of scanning radar data, OA is used to map data in antenna coordinates onto a regularly spaced Cartesian grid (Trapp and Doswell 2000). MMCG data are useful to scientists who are not familiar with radar coordinates. It is also useful to map radar data from radar coordinates to Cartesian coordinates because some schemes for data assimilation require a level of OA.
MMCG maps CMAC2 data using the Python ARM Radar Toolkit (Py-ART) open-source repository (Helmus and Collis 2016). The MMCG data contain reflectivity moments that are interpolated in linear Z units instead of logarithmic dBZ. This is preferable when looking at a larger convection area (Warren and Protat 2019).
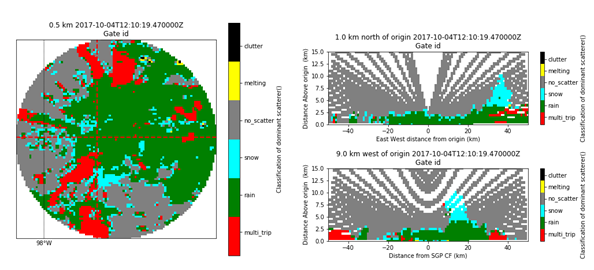
The MMCG data also contain a hydrometeor classification derived in CMAC2 and then mapped by taking its value from the closest radar measurement to the Cartesian location (known as nearest neighbor).
MMCG data from October 1, 2017, to April 5, 2019, are available for the X-Band Scanning ARM Precipitation Radar (XSAPR) at ARM’s Southern Great Plains I5 intermediate facility near Garber, Oklahoma.
Scientists can begin using the MMCG evaluation data now. The data are in the CfRadial netCDF format. Data from additional sites and dates will also be processed.
For more information about MMCG, go to the VAP web page. To ask questions or to report data problems, please contact Zachary Sherman or Scott Collis.
Users can access the data set from the ARM Data Center. (Go here to create an account to download the data.) Data can be referenced as doi:10.5439/1515170.
References:
Helmus JJ and SM Collis. 2016. “The Python ARM Radar Toolkit (Py-ART), a Library for Working with Weather Radar Data in the Python Programming Language.” Journal of Open Research Software, 4(1): p.e25, https://doi.org/10.5334/jors.119.
Trapp RJ and CA Doswell. 2000. “Radar Data Objective Analysis.” Journal of Atmospheric and Oceanic Technology 17(2): 105–120, https://doi.org/10.1175/1520-0426(2000)017<0105:RDOA>2.0.CO;2.
Warren RA and A Protat. 2019. “Should Interpolation of Radar Reflectivity be Performed in Z or dBZ?” Journal of Atmospheric and Oceanic Technology 36(6): 1143–1156, https://doi.org/10.1175/JTECH-D18-0183.1.
Follow Us:


Keep up with the Atmospheric Observer
Updates on ARM news, events, and opportunities delivered to your inbox
ARM User Profile
ARM welcomes users from all institutions and nations. A free ARM user account is needed to access ARM data.


