

EPCAPE Data Capture Historic Tropical Storm’s Properties
Published: 28 September 2023
Editor’s note: Israel Silber, an ARM data analyst at Pacific Northwest National Laboratory in Washington state, provided the following post about Tropical Storm Hilary, which is now the focus of a new data epoch.
While the Eastern Pacific Cloud Aerosol Precipitation Experiment (EPCAPE) is aimed at observing and improving our understanding of marine stratocumulus clouds and the influence of anthropogenic aerosol on those cloud systems, an unexpected event was recorded by the deployed ARM Mobile Facility (AMF) instruments.
Hurricane Hilary moved up Mexico’s west coast before becoming the first tropical storm to hit Southern California in 84 years (since 1939), generating extensive rainfall and strong winds. Most of the deployed ARM instruments at EPCAPE (excluding the scanning radars, which were shut down because of the high wind predictions) acquired data as the cyclone impacted the region between August 19 and 21, 2023.
Figure 1 depicts preliminary ARM measurements, with the top three panels showing Ka-Band ARM Zenith Radar observations of the equivalent reflectivity factor (a proxy for size and concentration of water particles), mean Doppler velocity (a proxy for water particle fall speed with negative values indicating downward movement), and Doppler spectral width (a proxy for water particle fall velocity and size variability). Cirrus (ice) clouds are detected starting at 12 UTC (4 a.m. local time) on August 19, providing hints of moisture steered to the region by the cyclone.
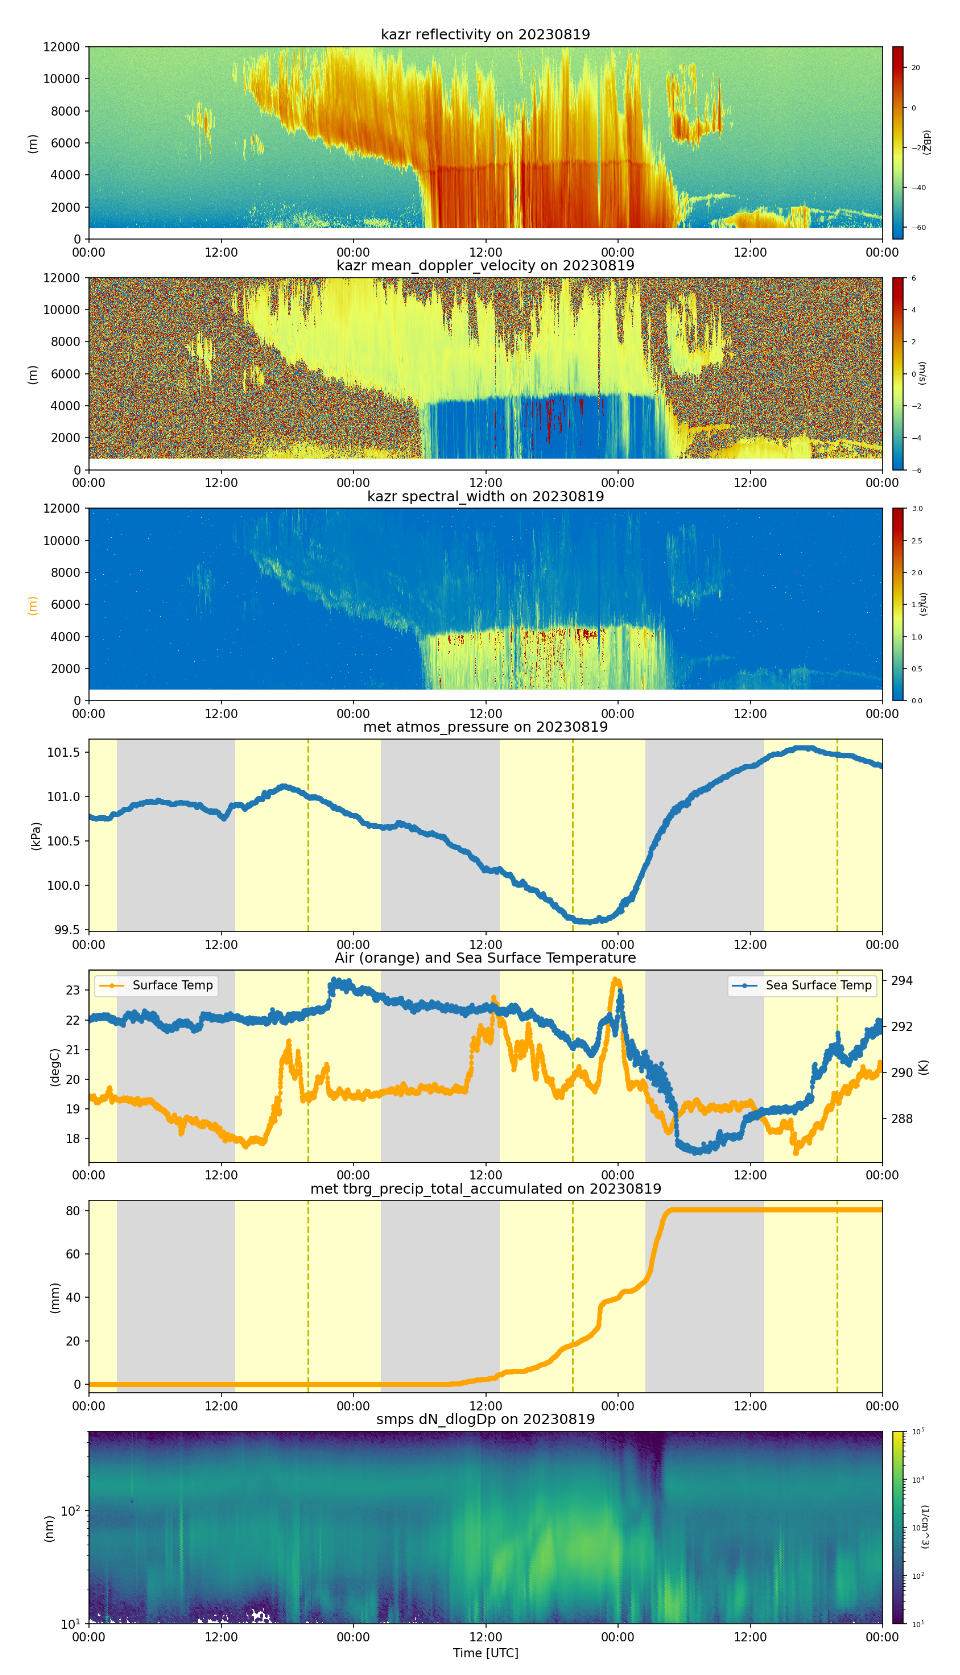
As the cyclone continues to propagate along the Pacific coast toward the EPCAPE site, the tropospheric column becomes more moist, clouds deepen, and surface precipitation commences (at ~8 UTC or midnight local time August 20), indicated by radar echoes from the cloud deck top, above 10 kilometers, down to the surface. (The total sky imager in the AMF deployment on the Scripps Pier and a camera mounted at the Mount Soledad site observing the pier provide a nice time-lapse depiction of the prefrontal clouds and the precipitating cells.)
A distinct enhancement in radar reflectivity (and linear depolarization ratio, which is not shown) at ~5 km indicates a melting layer above which snow particles are generated. The particles then precipitate to the surface as relatively fast-falling rain (Doppler velocity panel in Figure 1).
The very high spectral width values (dark red regions in the spectral width panel in Figure 1) could be influenced by significant wind shear and/or strong turbulence, but their general proximity to the melting layer suggests that those enhanced returns are most likely dominated by big drops (produced by the melting of very big snow particles). The combination of those big drops with smaller drops and/or snow particles that didn’t fully melt (mainly close to the melting layer) could generate those large values. As those are preliminary (uncorrected) data, some range folding is indicated in the mean Doppler velocity (dark red), suggesting that some of those melted large drops may precipitate (before breaking) at relatively large fall speeds greater than 6 meters per second.
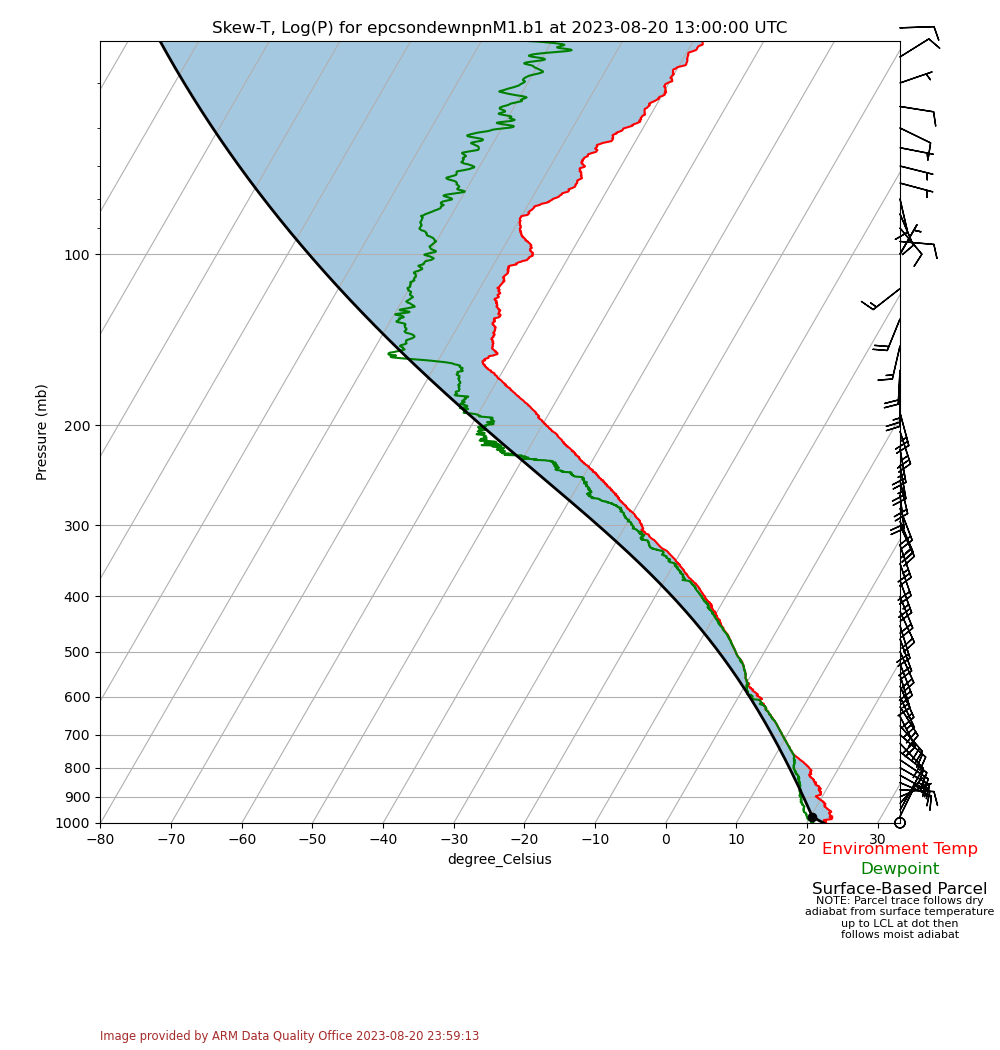
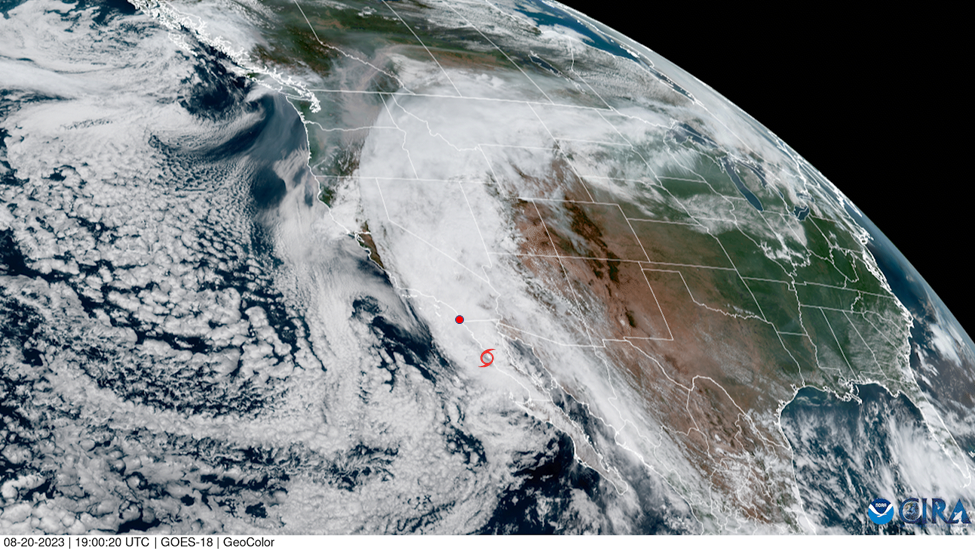
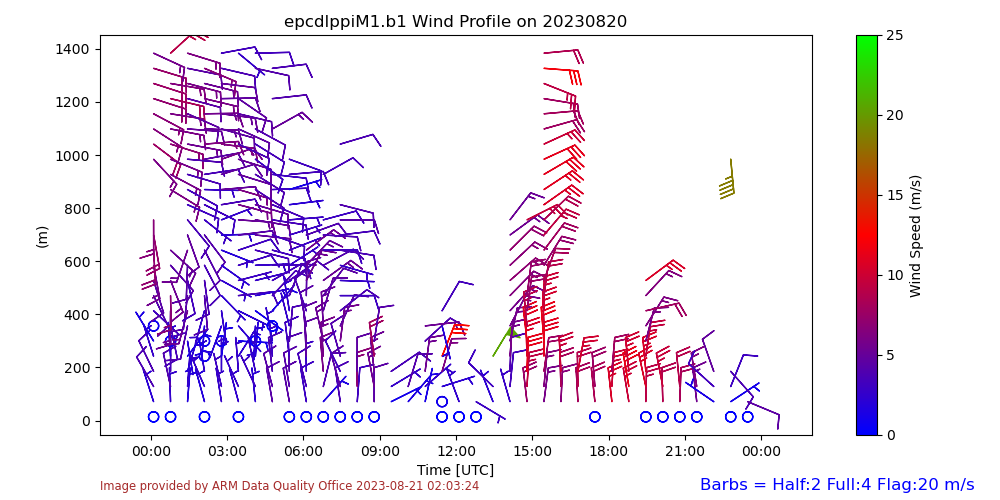
The moist atmosphere and the 0°C isotherm around 5 km are also indicated by the skew-T diagram generated using sonde measurements from 13 UTC on August 20, pulled from the ARM DQ Plotbrowser (Figure 2). This massive amount of moisture advection is also suggested by the GOES-18 satellite true-color image taken later that day (the tropical cyclone center and the EPCAPE site are denoted in Figure 3). The sonde measurements also inform on wind veering in the lower troposphere, with speeds exceeding 20 m/s (or ~45 miles per hour). Those high winds and wind veering features are persistent based on lower-tropospheric 3D profiling by the Doppler lidar (Figure 4).
The additional selected measurements depicted in Figure 1 describe a decrease in surface pressure toward the closest point to the cyclone center (very close to the ARM deployment), commensurate with the heaviest precipitation accumulation at the surface. Note that precipitation totals at the site exceeded 3 inches of rain in about 18 hours. Scanning mobility particle sizer measurements suggest a significant increase, mainly in Aitken mode aerosol concentrations closer to the cyclone center.
As demonstrated here, those and other ARM observations provide a comprehensive data set for this unique event, which merits additional analysis.
Follow Us:


Keep up with the Atmospheric Observer
Updates on ARM news, events, and opportunities delivered to your inbox
ARM User Profile
ARM welcomes users from all institutions and nations. A free ARM user account is needed to access ARM data.


