

AGU Scoop: MOSAiC Data Tell Tales of the Arctic
Published: 11 December 2020
December 11 at the 2020 American Geophysical Union (AGU) Fall Meeting featured two sessions—16 talks total—on coupled atmosphere-sea ice-ocean processes in the central Arctic.
(See the lists of presentations from Session 1 and Session 2; a third oral session is scheduled for 7–8 a.m. Pacific time Monday, December 14. NOTE: For meeting-specific links, use your AGU login to view.)
Most of the talks (13) related to the recently concluded Multidisciplinary Drifting Observatory for the Study of Arctic Climate (MOSAiC) expedition; the back-to-back events, convened by MOSAiC co-coordinator Matthew Shupe, intended to offer an initial glimpse at field observations and modeling attempts.
The four presentations featured below used ARM MOSAiC data and observations from other campaigns in which ARM was involved.
Aerosols and Trace Gases
ARM’s major contribution to the 2019–2020 MOSAiC expedition was deploying the second ARM Mobile Facility (AMF2), which included an Aerosol Observing System to measure the properties of atmospheric particles and trace gases.
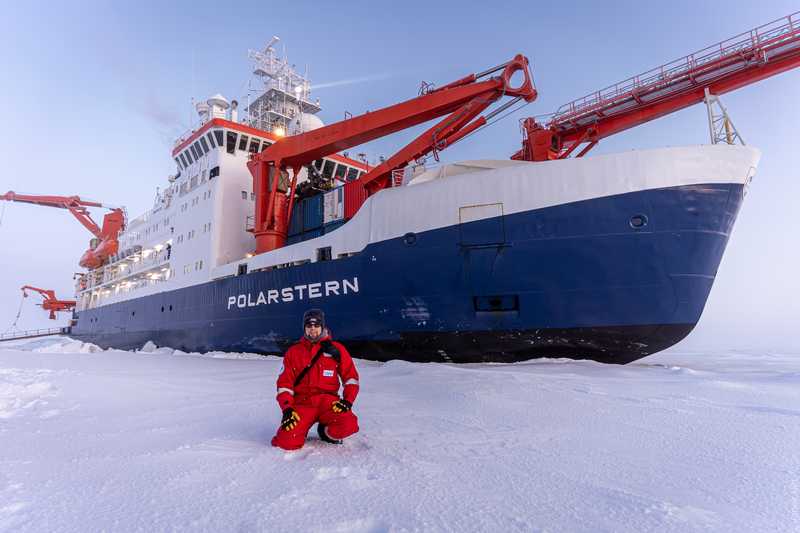
Helping to set up that gear in the first month of MOSAiC was Janek Uin, an ARM instrument mentor at Brookhaven National Laboratory in New York. He delivered the first presentation of the two AGU sessions.
Uin’s last day aboard the icebreaker R/V Polarstern was October 16, 2019, after a September 20 departure from the expedition’s home base at Tromsø, Norway, he noted in a blog. He and other ARM installation team members left AMF2 behind with teams of technicians that would rotate in and out for a year.
In the talk, Uin walked through an analysis of time-series ARM aerosol data spanning October 2019 to mid-May 2020. The entire period, he said, was marked by generally low trace gas amounts and aerosol number concentrations. Carbon monoxide remained low, without strong seasonal variations. Minor spikes created small increases in particle number concentration that were correlated with helicopter or snowmobile activity near the ship.
Further data analysis will include particle chemical composition but leave out samples associated with local contamination.
“It’s clear the data need to be filtered,” said Uin.
Springtime for MOSAiC
There comes a time every year in the Arctic when the surface energy budget transitions from wintertime net cooling to summertime net warming. This onset of surface melt over sea ice was the subject of a talk on intrusions of warm air delivered by Christopher Cox of NOAA’s Physical Sciences Laboratory.
For MOSAiC, Cox developed the meteorological and atmospheric surface flux stations that help measure the surface energy budget. In the field, during Leg 3, he was aboard the Akademik Fedorov, a Russian support icebreaker.
During the expedition, the crossover date from cold to warm was May 25, 2020, with the onset of an air intrusion from the south. What made that intrusion possible was the April breakup of the polar vortex, which allowed warm air masses from the North Atlantic to pulse into the Arctic. On May 25, what followed was a sustained melt lasting around 128 hours. That onset was similar to what occurred in 1998 during Surface Heat Budget of the Arctic Ocean (SHEBA), a 1997–1998 drifting polar field campaign to which ARM contributed.
Before the dramatic melt event in May, said Cox, instruments recorded four “pre-onset” events that occurred after April 13. The events had melting potential but were brief rather than persistent.
The study by Cox and others examines the surface energy budget in detail so that springtime warm air intrusions and their effect on melt are better understood.
Albedo and ‘Boots on the Ice’
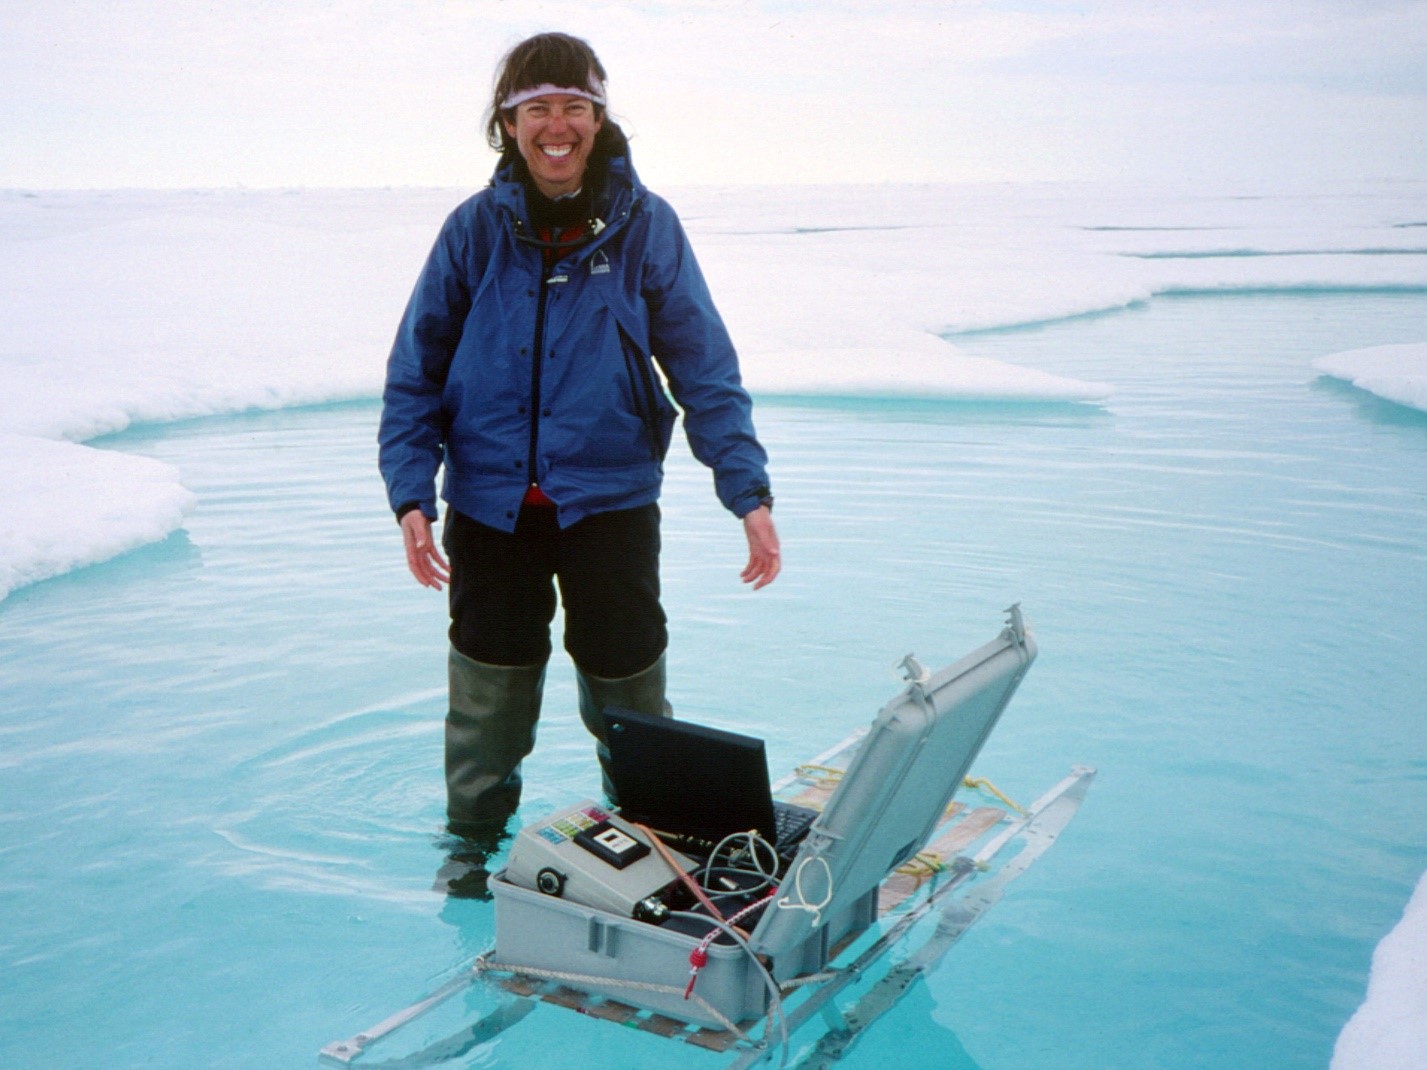
University of Washington researcher Bonnie Light’s talk compared observations of the evolution of arctic sea ice albedo—reflectivity—in campaigns 22 years apart. She took part in both.
The first was the SHEBA expedition in the Beaufort Sea, which was one of ARM’s earliest forays into polar regions. ARM opened its North Slope of Alaska atmospheric observatory barely three months after SHEBA began.
The second campaign in Light’s comparative duo was MOSAiC, though she participated remotely because of logistical difficulties caused by the COVID-19 pandemic.
For albedo data, both campaigns relied on researchers using handheld radiometers and walking transect lines.
“Having boots on the ice,” said Light, “allows us to build a spatial and temporal record that’s coordinated with details of physical property characterizations.”
During the Arctic’s sunlit months, the albedo of sea ice cover governs the surface radiative balance. This albedo is sensitive to the presence of several influences: snow; melt ponds; and light-absorbing material, such as dust or dark patches of exposed water. Quantifying the seasonal evolution of arctic albedo and its physical drivers is a high priority for both observationalists and modelers.
With SHEBA as the arctic albedo benchmark for sustained data, said Light, observations from the MOSAiC summer of 2020 now extend this record to what she and others call “the new Arctic,” the one affected by warming trends around the globe. Her study with others compares and contrasts observations from the two campaigns, including phases of melt evolution, melt pond formation, summer snowfall, sediment exposures, and other factors.
Though SHEBA and MOSAiC are “just snapshots” of spectral and broadband albedo, she said, their combined records can inform the next generation of how albedo is represented in models.
“These results are significant,” said Light. “They help us shore up the foundations for improved sea-ice radiative transfer parameters and increase the reliability of empirical models.”
Estimating Snowfall on Central Arctic Sea Ice
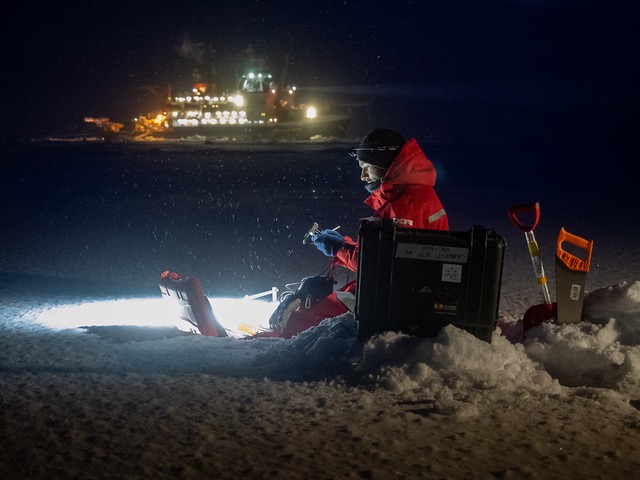
For a brief but vivid glimpse of research life out on arctic ice, you might start with a blog post by David Wagner, a PhD student at the Institute for Snow and Avalanche Research, Swiss Federal Institute for Forest, Snow, and Landscape Research. He was on the Sea Ice Team during MOSAiC.
Wagner and his teammates set out to get data for reliable estimates of snow on sea ice during Leg 1 of the expedition (October 24 to December 15), and they did so amid storms, shifting ice, and polar bears.
Wagner’s talk focused on getting those estimates in a landscape where little is known about the role of precipitation, blowing snow, and snow mass accumulation, especially during the four-month polar night. Still, snowfall estimates are particularly important to a lot of arctic sea ice research, in part because snowpack is important for ocean-atmosphere heat exchange.
“We somehow need to know what’s going into the system,” said Wagner.
He and others leveraged the fact that snowfall rates can be derived from radar reflectivity, so they leaned on datastreams from―among other instruments―ARM’s zenith and scanning cloud radars.
On the ice, the Sea Ice Team made detailed snow profile measurements, took terrestrial laser scans for snow depth, and walked transects with a magnaprobe snow-depth profiler.
Combined with data from ARM radars and other remote sensors, on-ice observations during Legs 1 and 2 of MOSAiC allowed for a detailed investigation of snowfall and blowing snow. Wagner said his presentation included the first evaluation results of combining ice- and ship-based sensors to derive snowfall rates.
–Contributions from ARM science writer Corydon Ireland
Planning your AGU schedule? Get more information about ARM-focused AGU presentations.
Follow Us:


Keep up with the Atmospheric Observer
Updates on ARM news, events, and opportunities delivered to your inbox
ARM User Profile
ARM welcomes users from all institutions and nations. A free ARM user account is needed to access ARM data.


