

XDS: GMS
GMS : Geostationary Meteorological Satellite
General Data Description
GMS-5 was part of a series of Japanese geostationary satellites stationed over the Western Pacific (140°E) from 1995-03 through 2003-05-21. It carried a Visible and Infrared Spin Scan Radiometer (VISSR) similar to the NOAA GOES satellites. After its failure in 2003 it was temporarily replaced by GOES-9 on loan from the US and then the MTSAT series. It’s primary measurements are cloud images in 1 visible and 3 infrared bands.
Measurement Description
twpgms5X1.a1.yymmdd.hhmmss.hdf
Data measured by the Visible and Infrared Spin Scan Radiometer (VISSR) with four channels, one in the visible part of the spectrum and three in the infrared. The ground resolution at the subsatellite point is 1.25 km in the visible channel and 5 km in the infrared. Some details of the GMS-5 satellite can be found at http://www.jaxa.jp/projects/sat/gms/index_e.html
The visible channel is averaged from 1.2 km to 5 km.
Resolution (IR & Vis) = 5.00 km
Image Dimensions (IR) = 677 lines x 1114 pixels
Projection = Mercator
Availability = Approximately hourly
| GMS 5 Images | Variable | Wavelength | Type | Units | Scale | Offset |
|---|---|---|---|---|---|---|
| 1) Visible channel ‘albedo’ | svissr_vis | 0.75 um | byte | albedo*100% | 0.3 | 0 |
| 2) Brightness temperature | svissr_ir1 | 10.8 um | byte | temp_deg_c | 0.5 | 188.15 |
| 3) Brightness temperature | svissr_ir2 | 11.5 um | byte | temp_deg_c | 0.5 | 188.15 |
| 4) Brightness temperature | svissr_ir3 | 6.9 um | byte | temp_deg_c | 0.5 | 188.15 |
| 5) Satellite-solar azimuth angle | rel_azimuth | n/a | float | degrees | 1 | 0 |
| 6) Satellite azimuth angle | sat_zenith | n/a | float | degrees | 1 | 0 |
| 7) Solar zenith angle | sun_zenith | n/a | float | degrees | 1 | 0 |
Temporal Coverage
GMS data are available beginning in October 1996 until the satellite failed on 2003-05-21.
The Minnis products are available as follows:
twplbtm3minnisX1.c1 begin 1998-01-03
twplbtm3minnismanX1.c1 and twplbtm3minnisnauX1.c1 begin 1999-06-16
twplbtm3minnisdarX1.c1 begin 2002-04-01
All these data streams end on 2003-05-21.
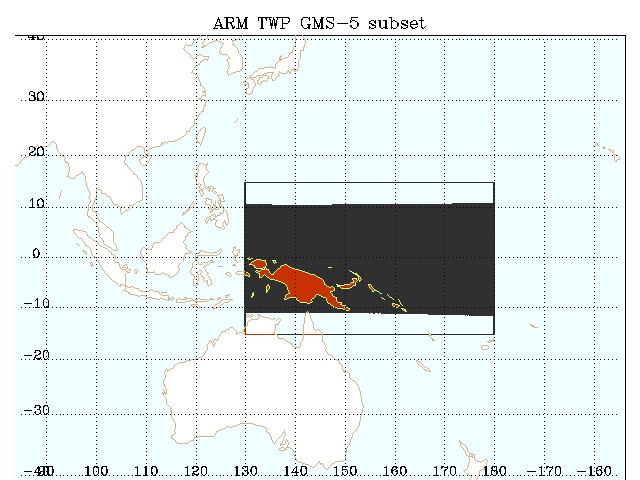
Area Covered
The GMS-5 satellite was stationed over 140°E longitude. A subset in sensor scan coordinates was extracted over the TWP domain (centered over 155°E, 00°N, extending roughly from 130°E to 180°E and 10°S to 10°N) and mapped onto a mercator projection from 130°E to 180°E and 15°S to 15°N which resulted in approximately 5° latitude bands to the North and South of the domain with no data (fill value).
Note: the latitude and longitude variables are not included in the output data-stream files but rather provided separately here:
twpgms5lat-lonX1.00.hdf
For your convenience there are several overlays prepared for lat/lon grids, and coastlines. The overlay files consist of an ‘image’ of value 1 everywhere, except at the positions of the features (coastlines) in which case the pixel value is zero. Thus the overlays can be written into the image by multiplying them together; the image data remain unchanged and the overlain pixels become zero.
twpgms5coastX1.hdf Overlay of coastlines
twpgms5grid1x1X1.hdf Overlay of 1 x 1 lat lon grid
twpgms5grid5x5X1.hdf Overlay of 5 x 5 lat lon grid
These files can be found through ARM Data Discovery
Data Stream Inputs
twpgms5fullX1.00.yymmdd.hhmmss.raw.g5.yyjjj.hhmm
Data Source
Institution
SeaSpace Corporation
NASA Langley Minnis Group
FAQ
Q: I would like to have some informations about the HDF formatting of twpgms5X1.a1 data. I have had problems reading the VIS and IR data of these files with the software PCI-GEOMATICS. Customer service of PCI wrote me: “The problem with the HDF file you reported is that the data is 8 bit signed and we only support 8U, 16S, 16U, and 32R.” I read the GMS data as 8 bit unsigned (0-255) so could it be possible that they are 8 bit signed?
A: You have uncovered a bug in the processing software that we use to generate the hdf file. The HDF data type for the infrared and visible imagery is written as “20” (8-bit integer type) whereas it should be “21” (8-bit unsigned integer type).When using Terascan or IDL, the data are read cleanly and the scaling can be correctly applied, but in NoESYS the data are indeed read as signed bytes. A problem notice has been filed with the supplier of the software but in the meantime the following solutions are offered.
- If you have TeraScan, use this to read in the data file (reformat using hdftotdf first) and do the analysis in TeraScan, or export the images you need as binary ‘flat files’ that can be read by most image processing or GIS systems.
- If you have IDL use this to read the data and do the analysis in IDL or write binary files. (Peter Minnett has tested this and can send you a simple program to do this if you wish)
- If you have Matlab, proceed as in (b) [Peter Minnett has not tested this]
- If you do not have access to the licenced software in (a) (b) or (c), you can use ‘hdp’ to extract the data from the hdf file. This software is available from http://www.hdfgroup.com/products/hdf4_tools/ and an example usage is given towards the bottom of http://www.arm.gov/data/files. Use the following unix command to extract the ‘svissr_ir1‘ image as a simple binary file called ‘ir1.bin‘ from the hdf file ‘twpgms5X1.a1.970307.083100.hdf‘: hdp dumpsds -n svissr_ir1 -d -o ir1.bin -b twpgms5X1.a1.970307.083100.hdf The resulting file is a byte array of dimensions [1114, 677]. This file should be readable by most GIS or image processing software.
Q: What is the relation that I have to use to calibrate the twpgms5X1.a1 data?
A: Once you have read the data as a byte array (0 to 255) the scaling of the visible channel to get ‘albedo‘ as a %, multiply the numbers in the array by 0.3. For the infrared images, multiply the numbers by 0.5 and add 188.15 to get brightness temperature in K.
When I try to download the lat/lon files for the GMS data, I get absurd values (~10^38) for the lat/lon.
A: These values are _FillValue and should be ignored. See section Area Covered for an explanation.
Data User Notes:
Note A – there is a known bug in earlier versions of tdftohdf which gives the incorrect data type code, 20, unsigned short integers, instead of 21, for signed short integers. If you use this information in converting the values read from the files to geophysical units, the answer may be wrong as the sign bit is misinterpreted. This affects most of the data currently available through the ARM Archive. Use of the information given in the HDF file header (metadata) gives the correct values.
E.g.: In MATLAB, manually change the output SDS type to uint8 (unsigned 8-bit integer).
Example Data


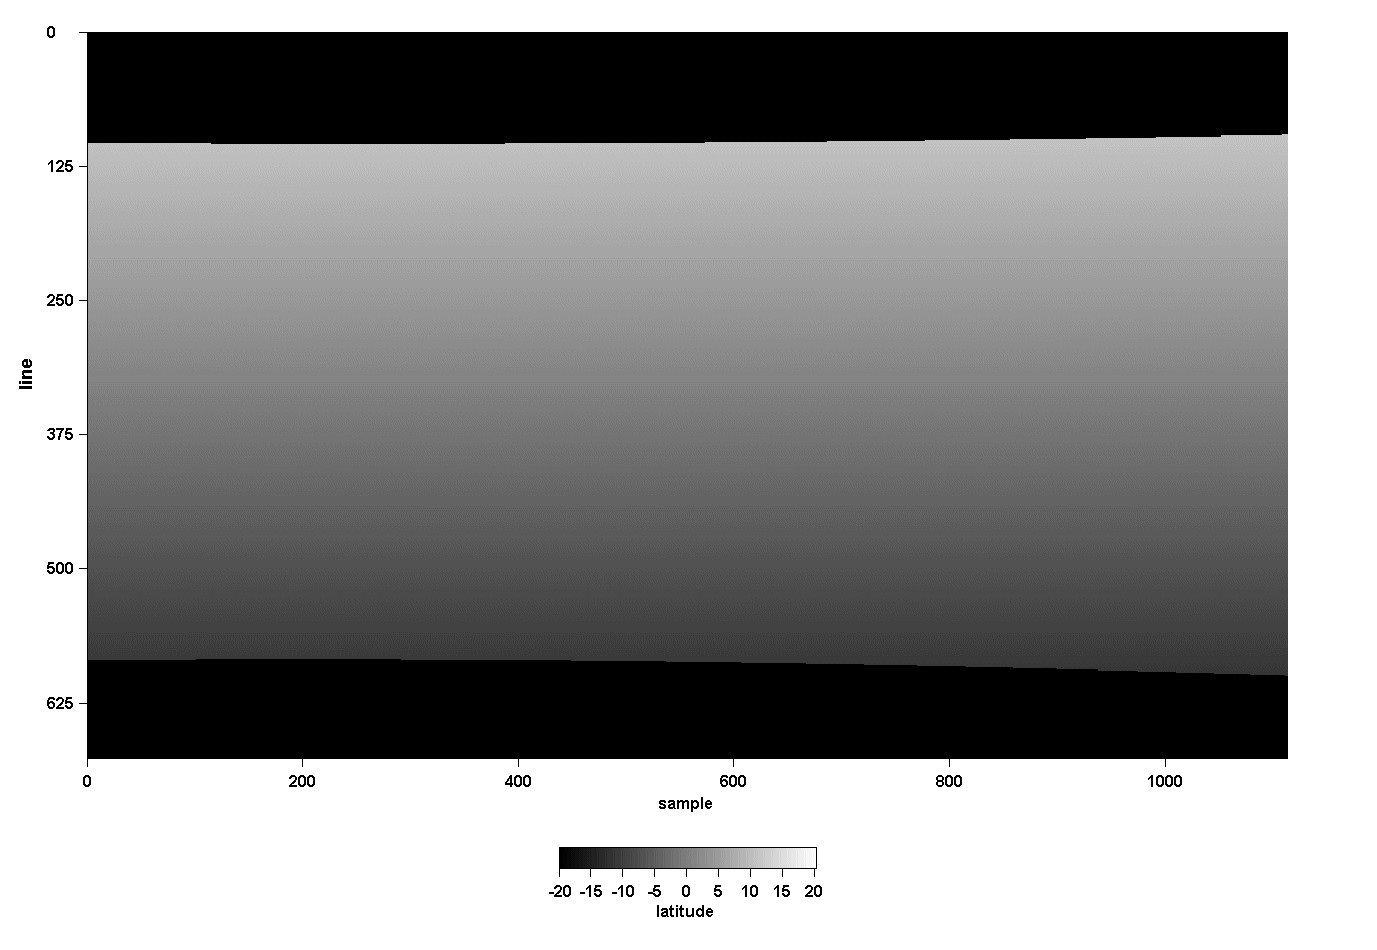
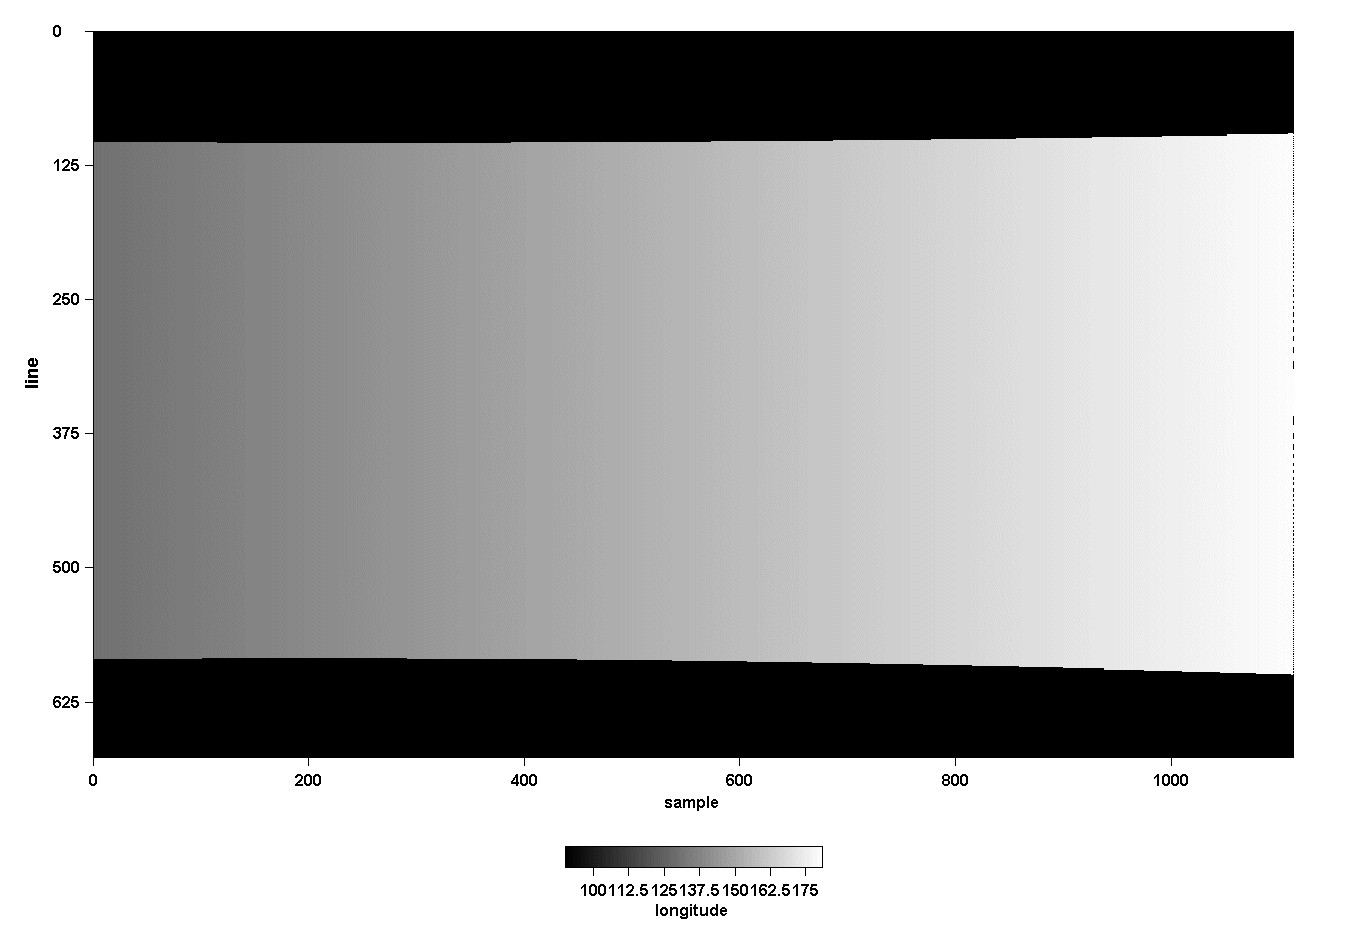
Images with latitude and longitude of each pixel
Note: overlay files contain an image that can be overlayed on a gms5 image by multiplying the overlay file and the image file
Acronyms
GMS     Geostationary Meteorological Satellite
HDF     Hierarchical Data Format
TDF     Terascan Data Format
TWP     Tropical Western Pacific
VISSR   Visible and Infrared Spin Scan Radiometer
Citable Reference
The normalized spectral response functions can be seen at http://isccp.giss.nasa.gov/docs/response/gms-5s.html (channel 1) and http://isccp.giss.nasa.gov/docs/response/gms-5i.html (channels 2-4)
Follow Us:


Keep up with the Atmospheric Observer
Updates on ARM news, events, and opportunities delivered to your inbox
ARM User Profile
ARM welcomes users from all institutions and nations. A free ARM user account is needed to access ARM data.


