

XDS: GOES
GOES: Geostationary Operational Environmental Satellites
General Data Description
Geostationary Operational Environmental Satellites (GOES) circle the Earth in geosynchronous orbits over the Equator. This means they observe the Earth from the exact same vantage point all the time. This allows the GOES satellites to continuously monitor a simple position on the Earth’s surface from a height of 35800 km. Typically, two GOES satellites provide half-hourly observations of the Americas and their surrounding environment, with one stationed over the east (GOES-east) and one over the west coast (GOES-west). ACRF collects and archive mostly just GOES-east data because it provides the best view of the SGP.
One major exception was the period 2003-05-12/2005-07-14 when GOES-9 was “loaned” to Japan to provide coverage of the western and central Pacific in a data gap between the end of the GMS-5 mission and the successful launch of the replacement MTSAT-1B.
Measurement Description
The primary observations in the GOES series are radiances in a broadband visible and several infrared channels. The visible radiance is typically converted and save as reflectance [percent] and the infrared radiances are converted and saved as brightness temperature [Celsius]. The detailed measurement characteristics have evolved over the years.
GOES-7 [pre 1995-04-06]
GOES-7 was the last of “first-generation” GOES satellites that flew the Visible Infrared Spin-Scan Radiometer Atmospheric Sounder (VISSR/VAS).
The full disk scans were started every half-hour and took approximately 20 minutes to complete. There are many gaps in the temporal sampling. The infrared images transmitted on the full hour are generally from channel 7 (12.6 μm), channel 8 (11.2 μm) and channel 10 (6.7 μm) and on the half-hour from channels 7, 8, and 12 (3.9 μm). In some cases the channel 7 data are replaced by images from channel 5 (13.3 μm). Both channels 5 and 7 are in the 10-13 μm atmospheric window, and therefore contain very similar signals, but of the channels 5 is more influenced by the atmosphere.
sgpgoes7visX1.a1.yymmdd.hhmmss.hdf
Visible channel only at full horizontal resolution (1 km sub-spacecraft)
sgpgoes7irX1.a1.yymmdd.hhmmss.hdfM
Infrared channel 7, 10, and 12 brightness temperatures
sgpgoes7radX1.a1.yymmdd.hhmmss.hdf
Infrared channel 7, 10, and 12 radiances
sgpgoes7ir8X1.a1.yymmdd.hhmmss.hdf
Infrared channel 8 brightness temperature
sgpgoes7rad8X1.a1.yymmdd.hhmmss.hdf
Infrared channel 8 radiance
GOES-8 [1994-12-15/2003-03-31]
GOES-8 was the first of the I-M series with a 5-channel (1 visible, 4 infrared) scanning imager.
For each time there are two output files: One contains the 1 km visible channel data, and ancillary fields, and the second contains all five channels at 4 km resolution, together with the ancillary fields. The ancillary fields are the solar and satellite zenith angles, and sun-satellite azimuth angles.
Prior to February 10, 1995, the input files were only available with a resolution of 8 km in all channels. This was simply the result of temporary limitations on disk capacity.
Nearest neighbor sampling is used in the re-mapping.
The visible channel (ch1) image is in albedo units and is calculated using the prelaunch channel characteristics. These images are stored as short integers in units of albedo(%)*100. The infrared channels are given as brightness temperatures, which are stored as short integers in units of oC; and angles are stored as floating-point numbers.
The scheduling of GOES images is controlled by NOAA and responds to the needs of the weather forecasting community. Our GOES data is collected and pre-processed by SeaSpace. The selection algorithm they use was intended to pick the GOES image that falls closes in start time to 15 and 45 minutes after the hour. That algorithm did not always work properly, but we do get for most days > 40 files per day. Visible channel data are processed only for the portions of the day when the Central Facility is sunlit.
sgpgoes8visX1.a1.yymmdd.hhmmss.hdf
Visible channel ‘albedo’
sgpgoes8X1.a1.yymmdd.hhmmss.hdf
Visible channel 1 ‘albedo’, and infrared channels 2-5 brightness temperature
The time at which the pixel measurement was made was added to the output files beginning 1998-09-24. Note that several pixels will appear to have the same time. In the along-scan direction this is a consequence of the finite time increment used in the calculation of the pixel time, and can be improved upon, if necessary, by least-squares fitting a curve to the pixel times to obtain times unique to each pixel. In the across-scan direction, the replication of pixel times is correct and results from the multiple detectors used in each channel. These detectors are aligned in a ‘north-south’ configuration, but away from the sub-satellite point and the Equator, the curvature of the earth causes inclination of the detector array when projected onto the Earth’s surface away from the local meridians.
GOES-9 [2003-05-12/2005-07-14]
Because of poor noise characteristics in the visible channel, GOES-9 was “moth-balled” soon after launch. However, when the Geostationary Meteorological Satellite (GMS-5), which was operated by the Japan Meteorological Agency (JMA) to provide meteorological data over the Asia-Pacific Region, developed technical problems with the main imaging instrument, GOES-9 was moved west and turned back on. It took over as a backup for the western Pacific region in May 2003.
The GOES-9 images are qualitatively very similar to GMS-5 images, except
- Geostationary coverage area is altered due to a different satellite position (GOES-9 is 15o further east than GMS-5)
- Hourly imagery is generally available
- Full-disc coverage is available (this was not available for some GMS-5 scans in early 2003)
- An additional infrared channel at 3.9 μm is available
- The GOES-9 visible channel is affected by coherent noise and this data is of slightly lower quality than might otherwise be expected
- The satellite operator, USA’s National Oceanic & Atmospheric Administration (NOAA), needs to undertake regular maintenance of the GOES-9 satellite and there are also eclipse periods, so that during the year there are occasions when some images are not available due to these protective actions by the operator
GOES-12 [2003-04-01/20081214]
GOES-12 data files are similar to GOES-8. The changes from GOES-8 are: The 6.7 μm water vapor channel (number 3) has a 4 km footprint instead of 8 km. The 11.5-12.5 μm water vapor channel (number 5) was moved to 12.9-13.8 μm (called channel number 6) and given a 8 km footprint instead of 4 km to determine cloud cover instead of volcanic ash and sea surface temperature. The TeraScan routine fastreg uses bi-linear interpolation to 4km x4km output fields, so the changes in resolution of the input fields should be transparent to the user of these data. The overlay files that were created for the GOES-8 data files can also be used to overlay the GOES-12 data files.
GOES-13 [2008-12/15-present]
GOES-13 data files are similar to GOES-12.
Temporal Coverage
GOES files are available at the ARM Data Center two days after the date generated. If files are missed in this “near-real-time” processing due to data communication or processing problems, they may be filled in from the ca. 1 week-long online buffer at SeaSpace a few days later.
| Satellite | Data Source | Begin Date | End Date | Comment |
|---|---|---|---|---|
| GOES-7 | McIDAS | 1994-01-17 | 1994-06-01 | |
| GOES-7 | SeaSpace | 1994-07-17 | 1995-04-06 | |
| GOES-8 | SeaSpace | 1994-12-15 | 2003-04-06 | |
| GOES-9 | SeaSpace | 2003-05-12 | 2005-07-14 | |
| GOES-10 | SeaSpace | 2007-12-06 | 2007-12-11 | Goes-west data are used occasionally to fill gaps in GOES-east coverage |
| GOES-12 | SeaSpace | 2003-04-01 | 2008-12-14 | |
| GOES-13 | SeaSpace | 2008-12-5 | Present | |
| GOES-14 | SeaSpace | 2012-09-11 | 2013-06-25 | GOES-west used to fill in gap in GOES-east coverage |
Area Covered
SGP
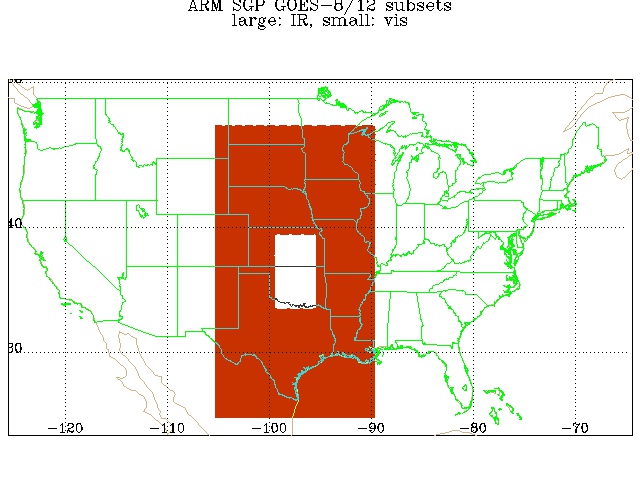
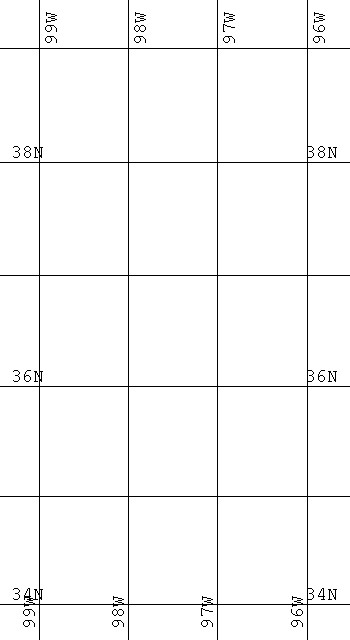
For the GOES-7, GOES-8, GOES-10, GOES-12, GOES-13, and GOES-14 data received from SeaSpace, images are rectified to a Mercator projection, centered at the SGP Central Facility (36.605° N, 97.485° W).
Each image consists of 640 lines of 350 pixels. The pixel size is 1 km for the visible channel images and 4 km for the infrared channels. The longitudes and latitudes of each pixel are always the same and prior to 2015-10-01 they were stored in separate files sgpgoes8irlat-longX1.00.hdf (IR channels, large area on map) and sgpgoes8vislat-longX1.00.hdf (Visible channel, small area on map).
Starting 2015-10-01, the latitude and longitude for each pixel are stored in the data files along with the radiometer data.
The areas covered are 33.66° N to 39.45° N, 99.43° W to 95.43° W for the visible channel images (small rectangle on the map), and 24.33° N to 47.26° N, 105.31° W to 89.65° W for the infrared channel images (large red rectangle on the map).
TWP
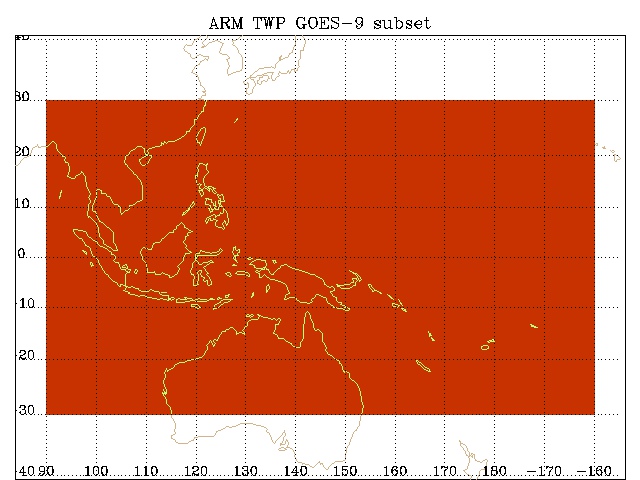
For GOES-9 the data are only archived during the time that it was replacing the Japanese Geostationary Satellites over the Western Pacific to provide coverage over the TWP from 30° S to 30° N, 90° E to 200° E.
For the GOES-9 data files the latitudes and longitudes of each pixel are included in every data file.
Data Stream Inputs
GOES-8
sgpgoes8X1.00
sgpgoes8visX1.00
GOES-10
sgpgoes10X1.00
sgpgoes10visX1.00
GOES-12
sgpgoes12X1.00
sgpgoes12visX1.00
GOES-13 until 2015-09-30
sgpgoes13X1.00
sgpgoes13visX1.00
GOES-13 beginning 2015-10-01
sgpgoes13X1.a0
sgpgoes13X1.a1
sgpgoes13visX1.a0
sgpgoes13visX1.a1
Related Links
GOES-8/9 Satellites
GOES-10/12 Satellites
Geostationary Operational Environmental Satellites
Office of Satellite and Product Operations Website
NASA Langley Minnis Group of Minnis Products
GOES-8 Normalized spectral response functions (ch 1 & 2)
GOES-8 Normalized spectral response functions (ch 3-5)
Contacts
ARM Data Center
Data Source
FAQ
Q: The SGP projection is listed as mercator with center lat 36.605 N and center lon 97.485 W— does this mean a traditional north–south mercator with coordinate origins at these center values, or is it an oblique mercator?
A: The HDF files at the archive are using regular (equatorial) Mercator projection:
line=scale*ln(tan(π/4+lat/(360/π)))+offset, where the arbitrary scale and offset are chosen such that (for example in the sgpgoes8X1.a1 data-stream, see corresponding sgpgoes8irlat-longX1.00.hdf file):
line=0 for lat=47.21 and
line=639 for lat=24.32
Q: How do you convert albedo units (for visible channels) and brightness temperatures (for IR channels) to sensor radiance?
A: For the IR channels you can recover the radiances from the brightness temperatures by inverting the Planck Function. Depending on your accuracy requirements, you could use a central wavenumber or wavelength for each channel, or use the full spectral response functions. Either way, the most efficient method would be to build a Look-Up Table. The visible channels are converted to radiance and albedo using the pre-launch calibration. This is described at: https://www.ospo.noaa.gov/Operations/GOES/calibration/
Data User Notes
Short Integer Type Bug
There is a known bug in earlier versions of tdftohdf which gives the incorrect data type code, 23, unsigned short integers, instead of 22, for signed short integers. If you use this information in converting the values read from the files to geophysical units, the answer may be wrong as the sign bit is misinterpreted. This affects most of the data currently available through the ARM Archive. Use of the information given in the HDF file header (metadata) gives the correct values.
Check for Data Quality Reports about these data at the ARM Data Quality Web Services
Information on reading hdf formatted files can be found at: Reading netCDF, HDF, and GRIB Files
Longitude/Latitude Interpolations During Map Projection
The reason why the longitude, latitude variables in the sgpgoes8irlat-longX1.00.hdf are not constant along the perpendicular directions is because of the way they are derived. The latitudes and longitudes are derived first on the sensor scan coordinates. When those are projected onto the mercator projection the program does “nearest neighbor” interpolation, and it also does this on the latitude and longitude variables. So they make little jumps when the nearest neighbor jumps from one line to another because of the “curvature” of the longitude/latitude lines as seen from the sensor. This is more apparent in the AVHRR data where the sensor scan lines are significantly tilted from the E-W direction.
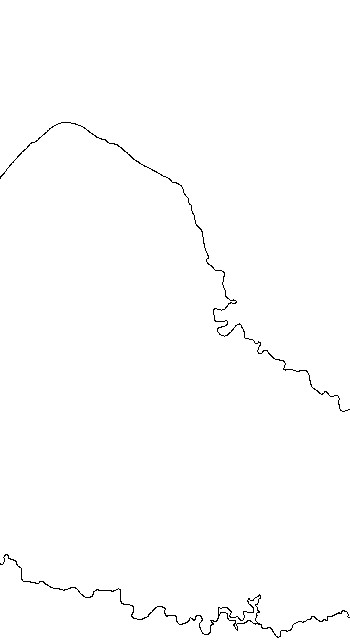
Another factor to consider is that there are inaccuracies in the spacecraft pointing caused by imperfections in the three-axis stability control. If the user is concerned about very accurate image navigation, the user should examine each image individually and adjust the geolocation by comparison with ‘ground control points’ – these are few and far between for the SGP, but the overlay file containing the position of rivers (sgpgoes8irriversX1.00.hdf and sgpgoes8visriversX1.00.hdf) are intended for this purpose.
Time Stamp on Filename NOT Time of First Data Sample
The start_time header attribute provided by NOAA refers to the beginning of the full disk scan, it is used in the time field of the HDF output file names. Since the area of interest is much smaller than the full disk, the time of first sample in the file is many minutes later than this start_time. This deviates from the standard ARM convention of naming the files with the time of the first data sample in the file.
Pay Attention to Time Unit
Prior to 2015-10-01, the unit of the time variable was “hhmmss”, but it was expressed as a float with fractional seconds.
Starting with 2015-10-01, the unit of the time variable is “s” (second since midnight UTC). And also starting on this date, the files include the latitude and longitude of each pixel.
Example Data


Note: overlay files contain an image that can be overlayed on a goes8 image by multiplying the overlay file and the image file.
The overlay files can be found at: The ARM Archive IOP Web page ref-data directory.
Quick Look Links
SGP GOES-8 8/12/13 Satellite Quick Looks
TWP GOES-9 Satellite Quick Looks
SGP GOES Satellite Hovmuller Diagrams
Acronyms
GOES    Geostationary Operational Environmental Satellites
HDF     Hierarchical Data Format
McIDAS  Man computer Interactive Data Access System),
TDF     Terascan Data Format
Follow Us:


Keep up with the Atmospheric Observer
Updates on ARM news, events, and opportunities delivered to your inbox
ARM User Profile
ARM welcomes users from all institutions and nations. A free ARM user account is needed to access ARM data.


