

XDS: ECMWFDIAG
ECMWFDIAG: European Centre for Medium Range Weather Forecast Diagnostic Analyses
General Data Description
Diagnostic Analyses data are derived from ECMWF model runs in simulated vertical profiles of diagnostic variables at specific locations or for area averages. The Physical Parametrization Group at ECMWF generates these data as a courtesy to ARM for all the ACRF sites including the changing location of the mobile facility.
These data can only be distributed to ARM scientists. ARM scientists who obtain these data must agree to acknowledge use of the data in their publications and not to share the data with others who are not on the ARM Science Team.
Derived data are defined as data from which the ECMWF fields cannot be re-created.
Such data can be freely distributed by ARM scientists.
The distribution of raw ECMWF fields to third parties is not allowed without the explicit permission of ECMWF. This is the general rule for all data supplied by ECMWF.
Permission can be requested to supply data to groups outside the ARM project for specific projects. In such cases, if permission was given, a conditions form would be produced by ECMWF to be signed by the principal investigator of such a group.
As of 07/25/2012, all ecmwf data covering TWP sites were reprocessed using the new facility ID. Please see the note in the section of reprocessing history for the details.
Measurement Description
ecmwfflx
These files contain the radiative fluxes throughout the atmosphere. The fluxes are averages over the last hour.
They are archived on the so called flux levels of the model (often referred to as half-levels). The full levels on which the variables are stored are placed between two flux levels. Hence, the largest level number represents the surface and level 1 the top of the atmosphere. Full level k is between half level k and k+1. The information of level can be found in ecmwfvar data.
- Net shortwave flux (W/m^2)
- Net longwave flux (W/m^2)
In addition, new measurements were added on 2010-12-07.
- Sensible heat flux (W/m^2)
- Turbulent momentum flux – u component (Pa)
- Turbulent momentum flux – v component (Pa)
ecmwfsfc (through 2000-09-12)
These files contain surface variables and fluxes. The level number is set to 1. The measurements are:
- *Soil temperature in layer 1 (7 cm deep) (K)
- Shortwave radiation (W/m^2)
- Longwave radiation (W/m^2)
- *Latent heat flux over water (W/m^2)
- *Latent heat flux over ice/snow (W/m^2)
- Sensible heat flux (W/m^2)
- *Ground heat flux between layer 1 and layers 2/3/4 (W/m^2)
- *Soil moisture in layer 1 (m^3/m^3)
- Large-scale rain (mm/s)
- Convective rain (mm/s)
- Large-scale snow (mm/s)
- Convective snow (mm/s)
- Surface pressure (Pa)
- **Turbulent moisture flux kg/kg * kg/(m^2*s)
* = Measurement in NSA and SGP files. No longer contained in new data stream immediately following.
** = Measurement in TWP files. No longer contained in new data stream immediately following.
Note the following two data streams replace ecmwfsfc beginning 2000-09-13)
The change in datastreams and measurements are a direct result of changes in the land-surface parametrization which became operational for the forecast starting 2000-09-12. The surface, “sfc”, data was split into two types of files – sfc1l and sfcml. “1l” stands for 1 layer and is available for all sites. “ml” stands for multi-level and are only available for sites which are considered land in the model (SGP and NSA and Darwin (DAR) for TWP also the mobile facilities PYE, NIM, FKB, HFE).
ecmwfsfc1l (beginning 2000-09-13)
This data stream contains the same measurements as ecmwfsfc which it replaces with the exceptions noted above. The new data stream also contains consistent measurement names across all the sites. The surface level for the TWP sites is now 1; in the older version of these files, it was set to 61. The measurements that are carried forward are:
- Shortwave radiation (W/m^2)
- Longwave radiation (W/m^2)
- Sensible heat flux (W/m^2)
- Large-scale rain (mm/s)
- Convective rain (mm/s)
- Large-scale snow (mm/s)
- Convective snow (mm/s)
- Surface pressure (Pa)
In addition, a new measurement has been added:
- Surface latent heat flux (W/m^2)
ecmwfsfcml (beginning 2000-09-13)
These measurements are all multilevel at 4 levels as represented in the ECMWF land-surface parametrization. The soil model layers have the following depths starting from the trop layer (layer 1 in the files): 7, 21, 72 and 189 cm.
The measurements are:
- Soil temperature (K)
- Heat flux at layer bottom (W/m^2)
- Moisture flux at layer bottom (kg/(m^2*s))
- Soil wetness (kg/m^2)
ecmwften
These files contain the total and physical tendencies for u,v,T and q on the model levels. The units are as in the ecmwfvar files but per second. The tendencies are:
- U total (m/s^2)
- U physics (m/s^2)
- V total (m/s^2)
- V physics (m/s^2)
- T total (K/s)
- T physics (K/s)
- Q total (kg/kg/s)
- Q physics (kg/kg/s)
ecmwfvar
These files contain the model variables on each model level. Level 1 is the top full level of the model (10 hPa). The level with the highest number is the lowest altitude full level. The measurements include:
- P – pressure (Pa)
- U – zonal wind component (m/s)
- V – meridional wind component (m/s)
- T – temperature (K)
- Q – specific humidity (kg/kg)
- L – specific cloud liquid water content (kg/kg)
- I – specific cloud ice content (kg/kg)
- A – cloud fraction (percent/100)
- R – relative humidity (percent/100)
- W – omega = vertical velocity in pressure coordinates (Pa/s)
ecmwfsfce (beginning January 1998)
These files contrain extra near surface and surface variables including:
- 2 m temperature (K)
- 2 m specific humidity (kg/kg)
- 10 m wind u-component (m/s)
- 10 m wind v-component (m/s)
- Skin temperature (K)
- Albedo
- Downward surface solar radiation (W/m^2)
- Downward surface longwave radiation (W/m^2)
- In addition, a new measurement was added on 2010-12-07: Surface evaporation (kg/m^2)
Temporal Coverage
The number of distinct locations that ECMWF can configure in their diagnostic analysis product is limited. Therefore, and since the ECMWF Physical Parametrization group is producing these products as a courtesy to ARM, a prior location often needs to be terminated before a new one can be brought online. The data are therefore not necessarily continuous for all ARM locations. Here’s a summary as of 2009-07-29:
| Site | Begin/End Date |
|---|---|
| NSA | 1997-09 |
| SGP IOPs | 1995-04-17/05-07, 1995-07-17/08-14, 1995-09-22/11-01, 1996-04-01/04-30, 1996-05-01/05-10, 1996-07-15/08-05 |
| SGP | 1996-08 |
| TWP Darwin | 2002-03-20 |
| TWP Manus | 1997-06 |
| TWP Nauru | 1999-01 |
| NIM | 2005-05-05/2007-03-27 |
| PYE | 2005-04-20/2005-10-21 |
| FKB | 2007-04-01/2008-02-29 |
| HFE | 2008-05-01/2009-04-30 |
| GRW | 2009-05-01/2013-09-30 |
| PGH | 2011-10-01/2013-09-30 |
| GAN | 2011-10-01/2013-09-30 |
| SMT | 2011-11-15 – present |
| PVC | 2012-07-01/2013-09-30 |
| TMP | 2013-09-01 – present |
| MAO | 2013-09-01 – present |
| OLI | 2013-09-01 – present |
| ENA | 2013-09-01 – present |
| AWR | 2015-10-09 – present |
| MCQ | 2016-06-16 – present |
Note: sgpecmwfsfcX1.c1 (netcdf files) begin 1996-08-01; prior to that only ascii files are available for the surface data. These diagnostic files are available at the ARM Archive with an approximately one month delay.
Area Covered
The single column data in the diagnostic files are either individual ECMWF model grid points or averages over several grid points in a rectangular domain defined by their upper left (NW) and lower right (SE) corners. The coordinates of the single grid points in the file are the closest model grid point coordinates to the desired location. When the resolution of the model changes (as it did on 2000-11-22) that can result in a change in those coordinates, see Data User Notes below.
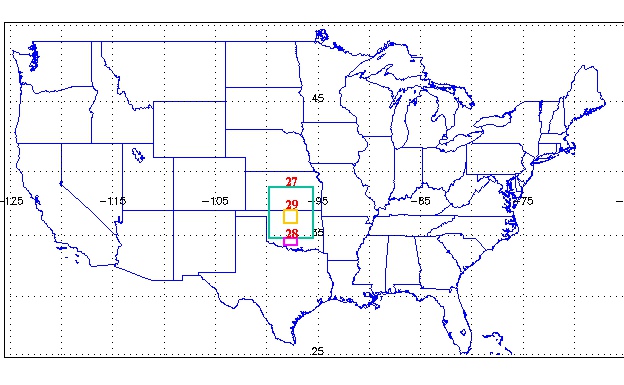
SGP
There are three SGP domains over which all the quantities are averaged.The area for those domains are:
| Point Number | Longitude Upper Left | Latitude Upper Left | Longitude Lower Right | Latitude Lower Right | Comment |
|---|---|---|---|---|---|
| 27 | 260.3 | 38.8 | 264.6 | 34.8 | |
| 28 | 261.7 | 34.8 | 263 | 34.2 | Eliminated 2002-03-20 |
| 29 | 261.7 | 37 | 263 | 36 |
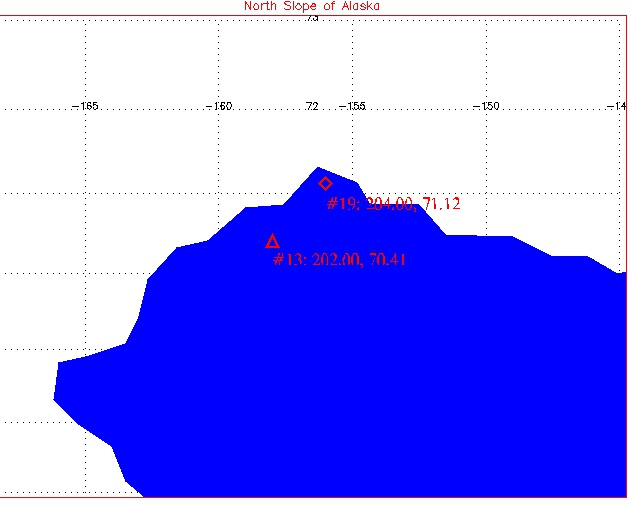
NSA
The NSA diagnostic data are available for two single points (numbered 13 and 19) located at:
| Point Number | Longitude | Latitude | Comment |
|---|---|---|---|
| 13 | 202.00 | 70.41 | Beginning 2002-03-20 |
| 19 | 203.20 | 71.05 | Before 2000-11-22 |
TWP Dar
There are three single points representing TWP Darwin. These data begin on 2002-03-20. Other domains in SGP, TWP Manus and TWP Nauru were eliminated to make room for these new points and for the new NSA point. The points are:
| Point Number | Longitude | Latitude |
|---|---|---|
| 6 | 130.43 | -12.82 |
| 28 | 129.73 | -12.47 |
| 50 | 131.13 | -13.52 |
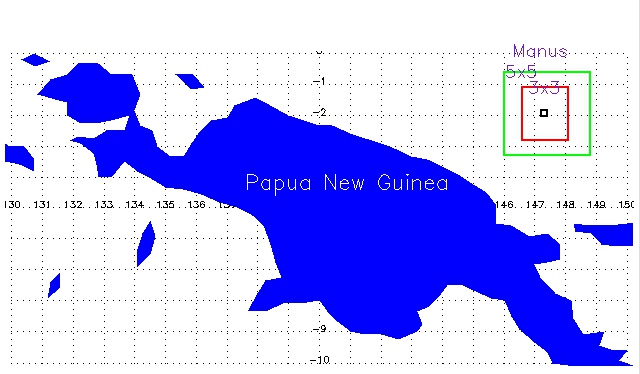
TWP Man
There are three TWP Manus domains over which all the quantities are averaged. The areas for those domains are:
| Point Number | Longitude | Latitude | Comment |
|---|---|---|---|
| 48 | 147.30 | -1.93 | Before 2000-11-22 |
| Point Number | Longitude Upper Left | Latitude Upper Left | Longitude Lower Right | Latitude Lower Right | Comment |
|---|---|---|---|---|---|
| 49 | 146.60 | -1.10 | 148.10 | -2.80 | |
| 50 | 146.00 | -0.60 | 148.80 | -3.30 | Eliminated 2002-03-20 |
TWP Nau
There are three domains for the TWP Nauru diagnostic data. The area for those domains are:
| Point Number | Longitude | Latitude | Comment |
|---|---|---|---|
| 4 | 167.06 | -0.28 | Before 2000-11-22 |
| 4 | 167.99 | -0.53 | Beginning 2000-11-22 |
| Point Number | Longitude Upper Left | Latitude Upper Left | Longitude Lower Right | Latitude Lower Right | Comment |
|---|---|---|---|---|---|
| 5 | 166.10 | 0.30 | 167.70 | -1.30 | |
| 6 | 165.50 | 0.90 | 168.30 | -1.90 | Eliminated 2002-03-20 |

The Manus and Nauru areas in the ECMWF model are all model sea points
AMF PYE 2005
The Point Reyes diagnostic domain consists of two single points:
| Point Number | Longitude | Latitude |
|---|---|---|
| 18 | 237.08 | 38.11 |
| 23 | 236.67 | 38.11 |
AMF NIM 2006
The Niamey diagnostic domain costs of a single point:
| Point Number | Longitude | Latitude |
|---|---|---|
| 76 | 2.46 | 13.52 |
AMF FKB 2007
The Black Forest diagnostic data domain consists of 3 COPS super-site locations:
| Point Number | Longitude | Latitude | Nearest Supersite |
|---|---|---|---|
| 115 | 8.32 | 48.46 | Supersite M, ARM AMF Murgtal, Heselbach: 8.495° E, 48.545° N, ca. 500 m |
| 116 | 8.67 | 48.68 | Supersite S, Gliders Airport Deckenpfronn, 8.813° E, 48.635° N, ca 600 m |
| 117 | 7.67 | 48.68 | Location POLDIRAD, Waltenheim sur Zorn 7.610° E, 48.739° N, ca. 120 m |
AMF HFE 2008
The China diagnostic data domain consists of 4 COPS super-site locations:
| Point Number | Longitude | Latitude | Nearest Supersite |
|---|---|---|---|
| 14 | 120.25 | 31.37 | ARM AMF Taihu: 120.22° E, 31.42° N, ca. 7 m |
| 15 | 117.00 | 39.69 | ARM AMF Xianghe: 116.96° E, 39.75° N, ca. 36 m |
| 115 | 116.75 | 32.49 | ARM AMF Shouxian: 116.78° E, 32.55° N, ca. 23 m |
| 116 | 100.69 | 39.01 | ARM AMF Zhanghe, 100.58° E, 38.93° N, ca. 1483 m |
AMF PGH 2011
The Ganges Valley, India diagnostic data domain consists of two points:
| Point Number | Longitude | Latitude | Nearest Supersite |
|---|---|---|---|
| 119 | 79.53 | 29.31 | Ganges Valley, India: 29.359° N, 79.458° E, ca 1943 m |
| 120 | 80.85 | 26.78 | Lucknow, India: 26.84° N, 80.96° E |
AMF GAN 2011
The Gan Island, Maldives diagnostic data domain consists of one point:
| Point Number | Longitude | Latitude | Nearest Supersite |
|---|---|---|---|
| 121 | 73.12 | -0.63 | Gan Island, Maldives: 73.14990° East, 0.69060° South, with ca. 1 m |
AMF SMT 2011
Summit Station, Greenland diagnostic data domain consists of one point:
| Point Number | Longitude | Latitude | Nearest Supersite |
|---|---|---|---|
| 116 | 321.75 | -72.60 | Summit Station, Greenland: 72.579° N, 38.499° W with ca. 3216 m |
AMF PVC 2012
| Point Number | Longitude | Latitude | Nearest Supersite |
|---|---|---|---|
| 124 | 290.00 | 41.96 | Highlands, Cape Cod, MA:42.03048° N, 70.04932° W with ca. 47.9 m |
| 125 | 289.81 | 41.68 | Highlands, Cape Cod, MA:42.03048° N, 70.04932° W with ca. 47.9 m |
| 126 | 292.31 | 43.51 | Highlands, Cape Cod, MA:42.03048° N, 70.04932° W with ca. 47.9 m |
| 127 | 292.50 | 44.08 | Highlands, Cape Cod, MA:42.03048° N, 70.04932° W with ca. 47.9 m |
| 128 | 292.88 | 42.66 | Highlands, Cape Cod, MA:42.03048° N, 70.04932° W with ca. 47.9 m |
| 129 | 292.59 | 41.96 | Highlands, Cape Cod, MA:42.03048° N, 70.04932° W with ca. 47.9 m |
| 130 | 292.68 | 41.26 | Highlands, Cape Cod, MA:42.03048° N, 70.04932° W with ca. 47.9 m |
| 131 | 292.14 | 40.55 | Highlands, Cape Cod, MA:42.03048° N, 70.04932° W with ca. 47.9 m |
| 132 | 291.78 | 40.13 | Highlands, Cape Cod, MA:42.03048° N, 70.04932° W with ca. 47.9 m |
| 133 | 290.16 | 39.85 | Highlands, Cape Cod, MA:42.03048° N, 70.04932° W with ca. 47.9 m |
| 134 | 287.28 | 40.70 | Highlands, Cape Cod, MA:42.03048° N, 70.04932° W with ca. 47.9 m |
AMF TMP 2013
Hyytiala, Finland diagnostic data domain consists of one point:
| Point Number | Longitude | Latitude | Nearest Supersite |
|---|---|---|---|
| 130 | 24.19 | 61.50 | Hyytiala, Finland, 61° 50′ 36.73″ N, 24° 17′ 16.25″ E 179 m |
AMF MAO 2013
Manacapuru, Brazil diagnostic data domain consists of two points:
| Point Number | Longitude | Latitude | Nearest Supersite |
|---|---|---|---|
| 131 | 299.39 | -3.16 | Manacapuru, Brazil, 3° 12′ 47.70″ S, 60° 35′ 53.00″ W 49.99 m |
| 132 | 299.35 | -3.02 | Manaus Airport, 3° 2′ 19.05″ S, 60° 2′ 47.55″ W 71,63 m |
AMF OLI 2013
Oliktok Point, Alaska diagnostic data domain consists of one point:
| Point Number | Longitude | Latitude | Nearest Supersite |
|---|---|---|---|
| 129 | 210.00 | 70.50 | NSA – Oliktok Point, Alaska, 70° 29′ 42.89″ N, 149° 53′ 12.78″ W 2 m |
AMF ENA 2013
Graciosa Island diagnostic data domain consists of one point:
| Point Number | Longitude | Latitude | Nearest Supersite |
|---|---|---|---|
| 14 | 331.91 | 39.15 | ENA – Graciosa Island, Azores: 39° 5′ 29.68″ N, 28° 1′ 32.34″ W 30.48 m |
AMF AWR 2015
McMurdo Station on the southern tip of Antarctica. The diagnostic data domain consists of three points:
| Point number | Longitude | Latitude | Nearest Supersite |
|---|---|---|---|
| 133 | 166.88 | -77.81 | McMurdo Station Site: 77° 50′ 58.6″ S, 166° 43′ 42.4″ E 68 m |
| 134 | 166.25 | -77.81 | McMurdo Station Site: 77° 50′ 58.6″ S, 166° 43′ 42.4″ E 68 m |
| 135 | 248.25 | -79.49 | McMurdo Station Site: 77° 50′ 58.6″ S, 166° 43′ 42.4″ E 68 m |
AMF MCQ 2016
Macquarie Island diagnostic data domain consists of one point:
| Point number | Longitude | Latitude | Nearest Supersite |
|---|---|---|---|
| 138 | 158.96 | -54.52 | MCQ – Macquarie Island, 54.30°S, 158.57° E 200 m |
Data Stream Inputs
The diagnostic analysis files are received in ASCII format (1 file per point per type [var,ten,sfc1l,sfcml,sfce]) from the ECMWF and archived in daily tar bundles in the following .00 level data-streams:
awrecmwfX1.00
enaecmwfX1.00
mcqecmwfX1.00
pvcecmwfX1.00
pghecmwfX1.00
ganecmwfX1.00
smtecmwfX1.00
fkbecmwfX1.00
grwecmwfX1.00
hfeecmwfX1.00
nimecmwfX1.00
nsaecmwfX1.00
pyeecmwfX1.00
sgpecmwfX1.00
twpecmwfX10.00
twpecmwfX20.00
twpecmwfX30.00
Related Links
ECMWF Web Site
ECMWF Model Revision History
ECMWF Operational Upgrades
Contacts
ARM Data Center
Data Source
Institution
Physical Parametrization Group at ECMWF
Reprocessing History
Reprocessing Date
Manus(X10): 199706-201206
Nauru(X20): 199901-201206
Darwin(X30): 200203-201206
Start End Processing
Reason Reprocessing
All twpecmwf data were reprocessed with the new facility ID (X10 -man, X20-
nau and X30-dar). Below is the comparative chart of the change.
OLD vs NEW
twpecmwfX1.00 —–> twpecmwfX10.00
twpecmwfmanflxX1.c1 —-> twpecmwfflxX10.c1
twpecmwfmansfcX1.c1 —-> twpecmwfsfcX10.c1
twpecmwfmansfc1lX1.c1 —-> twpecmwfsfc1lX10.c1
twpecmwfmansfceX1.c1 —-> twpecmwfsfceX10.c1
twpecmwfmantenX1.c1 —-> twpecmwftenX10.c1
twpecmwfmanvarX1.c1 —-> twpecmwfvarX10.c
twpecmwfnauX1.00 —–> twpecmwfX20.00
twpecmwfnauflxX1.c1 —-> twpecmwfflxX20.c1
twpecmwfnausfcX1.c1 —-> twpecmwfsfcX20.c1
twpecmwfnausfc1lX1.c1 —-> twpecmwfsfc1lX20.c1
twpecmwfnausfceX1.c1 —-> twpecmwfsfceX20.c1
twpecmwfnautenX1.c1 —-> twpecmwftenX20.c1
twpecmwfnauvarX1.c1 —-> twpecmwfvarX20.c1
twpecmwfdarX1.00 —–> twpecmwfX30.00
twpecmwfdarflxX1.c1 —-> twpecmwfflxX30.c1
twpecmwfdarsfc1lX1.c1 —-> twpecmwfsfc1lX30.c1
twpecmwfdarsfcmlX1.c1 —-> twpecmwfsfcmlX30.c1
twpecmwfdarsfceX1.c1 —-> twpecmwfsfceX30.c1
twpecmwfdartenX1.c1 —-> twpecmwftenX30.c1
twpecmwfdarvarX1.c1 —-> twpecmwfvarX30.c1
FAQ
Q: The old twpecmwf[xxx]sfcX1.c1 (pre 2000-09-13) files had “turbulent moisture flux”. Does this match to anything in the new files (or to anything in SGP/NSA)?
A: (from Christian Jacob, ECMWF): “Yes and no. Due to the backing out procedure we had to apply for the TWP sites, we did not have the surface latent heat flux at those sites and replaced it by the moisture flux (which can be converted into the former). Now that we cleaned up the mess, we do have surface latent heat flux instead, which is cleaner. Again, it comes in different units and is therefore not a direct replacement, although it contains the same information.”
Q: Often soil wetness in a generic sense is expressed in terms of (volumetric) soil moisture content, which is unitless or has units of m^3/m^3. For example, a corresponding old term was “soil moisture in layer 1 (m^3/m^3) (soil_moisture in sgp and nsa).” The new “soil wetness” seems to represent the amount of water integrated with depth for each layer. Can someone confirm that this interpretation is correct?
A: The interpretation of soil wetness in the question is correct.
Q: Is the model elevation at Barrow 8 m?
A: No, it is 5 m.
Q: Is there any information on model ozone available?
A: No, there is no information on ozone in any of these products.
Q: Are the variables in the diagnostic files to be interpreted as hourly averages for the hour prior to the time-stamp?
A: From Martin Köhler at ECMWF: Yes and No! The answer depends on the type of variable:
for fluxes and tendencies: average over previous hour before time stamp (e.g. latent heat flux)
other variables: instantaneous value at time stamp (e.g. T2m or cloud cover)
Data User Notes
Acknowledgement
Publications should refer to: “The ECMWF operational analysis and forecasting system: The full evolution http://www.ecmwf.int/products/data/operational_system/index.html”
Why single data points moved in diagnostic ECMWF files
To generate point data in the diagnostic files, ECMWF specifies to the model the lat-lon of the observation point, and get as an output the nearest model point. When the model grid changes (such as on 2000-11-22, where the model resolution increased from ~60 km to ~40 km), the location of the nearest model point changed.
Discussion from Christian Jacob on changes to diagnostic files on 2000-09-13
In June 2000 we introduced a new land surface parametrization scheme into our model. We immediately realised that the diagnostic tool that we are using (amongst many other applications) to get out the data for the ARM sites was totally inadequate for the new scheme. This, together with some things we did not like even for the old parametrization scheme, led us to invest some time to completely rewrite the surface part of this diagnostic tool. The changes that you see are repercussions of this rewrite. The rewritten diagnostics became operational on 2000-09-12, hence affecting ARM data from 2000-09-13 onwards.
To give you an example of the sort of changes: The old diagnostic tool did not provide any direct information at the surface over sea points in the model. It so happens that Manus and Nauru are way too small islands to be land points even in our highest of model resolutions. Therefore, we had to play all sorts of tricks to back out things like surface fluxes from other parts of the archive. That is the reason why you had different files for the TWP sites in the past. Obviously, since we rewrote the software anyway, we wanted to get rid of that problem, and we did. Hence, now all the files are exactly the same. The only difference is that you have extra files at the locations that are really land in the model (SGP and NSA), that deal with real land parameters, such as soil temperature and soil moisture, which obviously don’t exist at sea points.
The difference in measurement names between old and new are also due to the cleaup.
Vertical resolution change
The operational ECMWF model changed vertical resolution from 91 to 137 levels at 12Z 25 June 2013. it affected the data from 26 June onwards.
A note on the resolution
The resolution depends on the time period you are looking at. The data is extracted from the operational model at the time. Since Jan 26 2010, the horizontal resolution has been at T1279 (triangular truncation 1279), which corresponds to a grid point spacing of approximately 16km. Previously (Feb 1st 2006 – Jan 25 2010), it was T799/~25km. Nov 21st 2000-Jan 31st 2006 it was T511/40km.
Acronym
ECMWF   European Centre for Medium Range Forecasts
GRIB    GRIdded Binary
Citable References
Follow Us:


Keep up with the Atmospheric Observer
Updates on ARM news, events, and opportunities delivered to your inbox
ARM User Profile
ARM welcomes users from all institutions and nations. A free ARM user account is needed to access ARM data.


