

XDS: AVHRR
AVHRR: Advanced Very High Resolution Radiometer
General Data Description
Measurements from the Advanced Very High Resolution Radiometer (AVHRR) on the NOAA polar orbiting satellites taken over the NSA, SHB, SGP and TWP sites are available for distribution to the ARM community.
Measurement Description
nsaavhrrnnX1.a1.yyyymmdd.hhmmss.hdf
shbavhrrnnX1.a1.yyyymmdd.hhmmss.hdf
sgpavhrrnnX1.a1.yyyymmdd.hhmmss.hdf
twpavhrrnnlacsssX1.a1.yyyymmdd.hhmmss.hdf
twpavhrrnngacsssX1.a1.yyyymmdd.hhmmss.hdf
where nn <= 15
| Variable | Name | Type Units |
|---|---|---|
| Ch 1 `albedo’ | avhrr_ch1 | short albedo*100% |
| Ch 2 `albedo’ | avhrr_ch2 | short albedo*100% |
| Ch 3 brightness temperature | avhrr_ch3 | short temp_deg_C |
| Ch 4 brightness temperature | avhrr_ch4 | short temp_deg_C |
| Ch 5 brightness temperature | avhrr_ch5 | short temp_deg_C |
| satellite-solar azimuth angle | rel_azimuth | float degrees |
| satellite zenith angle | sat_zenith | float degrees |
| solar zenith angle | sun_zenith | float degrees |
nsaavhrrnnradX1.a1.yyyymmdd.hhmmss.hdf
shbavhrrnnradX1.a1.yyyymmdd.hhmmss.hdf
sgpavhrrnnradX1.a1.yyyymmdd.hhmmss.hdf
| Variable | Name | Type Units |
|---|---|---|
| Ch 3 calibrated radiances (Channel 3b beginning with NOAA 16*) | avhrr_ch3 | short mW_m-2_st-1 |
| Ch 4 calibrated radiances | avhrr_ch4 | short mW_m-2_st-1 |
| Ch 5 calibrated radiances | avhrr_ch5 | short mW_m-2_st-1 |
*Note – beginning with NOAA 16 channel only appears in these files during hours when channel 3b is available (usually nighttime hours). The reflected solar radiation channels (1 & 2) data are in albedo units and are calculated using the prelaunch channel characteristics, and are stored as short integers in units of albedo (%) * 100. The conversion from digital counts (n) to albedo (alb) follows:
alb = a + b*n
For NSA NOAA-14, time dependent coefficients are used. The table is updated whenever new coefficients are released by NOAA.The infrared channels are given as brightness temperatures, which are stored as signed two byte integers in increments of 0.01°C. These are derived using the in-flight calibration data derived from measurements of cold space and the on-board black-body calibration target. Angles are calculated from the orbit geometry and are stored as floating-point numbers. Beginning with NOAA 16, channel 3 becomes channel 3b (the thermal (longwave) channel; and channel 3a is added in daylight hours. However, on NOAA 16, channel 3a failed in April 2003 and beginning on May 1, 2003 channel 3b appears at all time. The wavelengths of the channels can be found at NOAA 16 AVHRR Subsystem Summary.
| Satellite NOAA-12 | a | b |
|---|---|---|
| Channel 1 | -4.44908 | 0.104223 |
| Channel 2 | -3.99256 | 0.10144 |
Temporal Coverage
| North Slope of Alaska (NSA) | ||
|---|---|---|
| Satellite | Start Date | End Date |
| avhrr10 | 1997-11-09 | 1999-10-09 |
| ahvrr12 | 1997-10-01 | 2007-03-31 |
| avhrr14 | 1997-10-01 | 2007-03-31 |
| avhrr15 | 1998-11-10 | 2007-03-31 |
| avhrr16 | 2003-03-08 | 2007-03-31 |
| avhrr17 | 2003-03-09 | 2007-03-31 |
| avhrr18 | 2005-09-25 | 2007-03-31 |
| Southern Great Plains (SGP) | ||
|---|---|---|
| Satellite | Start Date | End Date |
| avhrr9 | 1994-09-15 | 1994-12-30 |
| ahvrr10 | 1997-10-01 | 2007-03-31 |
| avhrr11 | 1994-07-21 | 1995-09-11 |
| avhrr12 | 1994-07-22 | 2007-09-22 |
| avhrr14 | 1995-01-18 | 2002-08-05 |
| avhrr15 | 2000-07-05 | 2007-09-22 |
| avhrr16 | 2000-12-09 | 2005-10-19 |
| avhrr17 | 2002-06-27 | 2007-09-22 |
| avhrr18 | 2005-10-14 | 2007-09-22 |
| Tropical Western Pacific (TWP) | |||
|---|---|---|---|
| Satellite | Start Date | End Date | |
| avhrrkwaj12 | 2002-07-12 | 2002-09-10 | |
| avhrrkwaj14 | 2000-07-12 | 2007-03-31 | |
| avhrrkwaj16 | 2001-03-02 | 2005-08-29 | |
| avhrrkwaj17 | 2002-09-15 | 2007-03-31 | |
| avhrrkwaj18 | 2005-10-15 | 2007-03-31 | |
| avhrr14gacman | 1996-11-22 | 2001-10-31 | |
| avhrr14gacnau | 1996-11-22 | 2001-10-31 | |
| avhrr15gacman | 2002-01-01 | 2002-10-01 | |
| avhrr15gacnau | 2002-01-01 | 2002-10-01 | |
| avhrr16gacman | 2001-10-27 | 2002-10-01 | |
| avhrr16gacnau | 2001-10-27 | 2002-10-01 | |
| SHEBA | ||
|---|---|---|
| Satellite | Start Date | End Date |
| avhrr10 | 1997-11-09 | 1998-10-24 |
| avhrr11 | 1998-03-14 | 1998-10-13 |
| avhrr12 | 1997-10-01 | 1998-10-31 |
| avhrr14 | 1997-10-01 | 1998-10-31 |
SGP AVHRR data are available at the ARM Archive within a day or two after collection. Data files that are missed are filled in from tapes sent by SeaSpace with an approximate delay of a month.
NSA AVHRR data are available at the ARM Archive approximately six months after date of collection.
The 1 km and 4-km resolution files provided by the University of Miami for Manus and Nauru are available with about a 1 year delay.
The TWP 1-km resolution files provided by Aeromet, received at their station in Kwajalein covering TWP Nauru are available with a one month delay.
The TWP files provided by the Australian BOM covering Darwin are available approximately three months after they are collected. These files are only available in their native ASDA format.
Area Covered
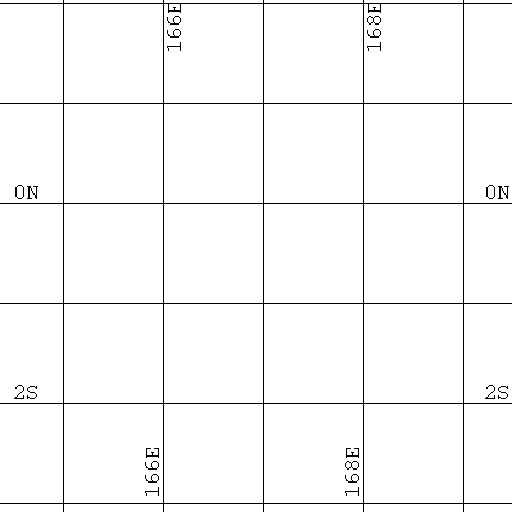
For NSA, the image data are remapped into a polar stereographic projection centered at latitude 71° 18.00′ N, longitude 156° 41.00′ W, covering the area shown below.
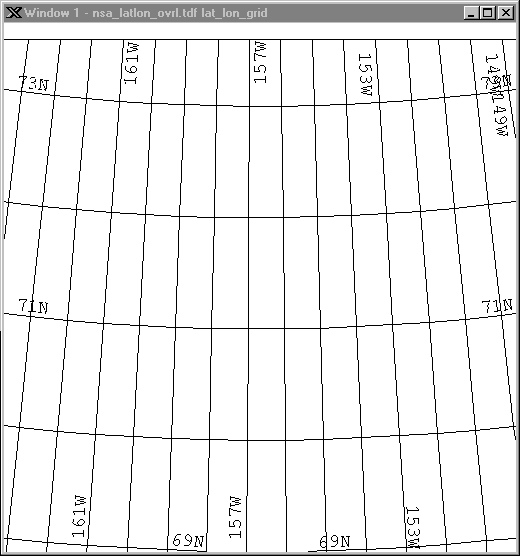
The images consist of 512 x 512 1 km^2 pixels, and the geographic location of these is available in a separate file.
The image data are remapped into a polar stereographic projection centered at latitude 77° N, longitude 155° W, covering the area shown below.
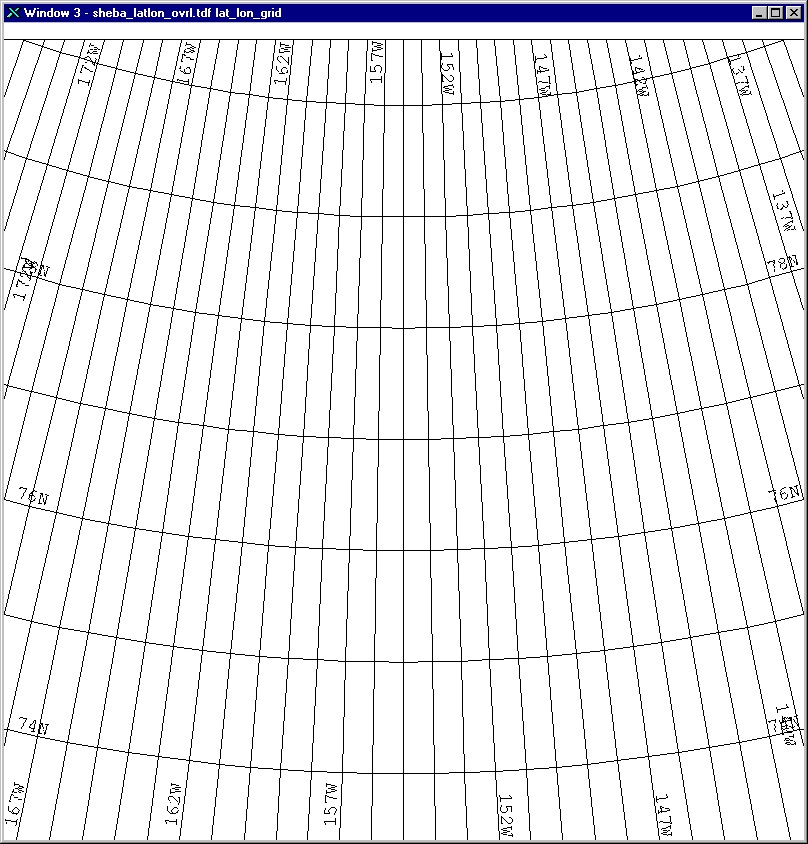
The images consist of 800 x 800 1 k^2 pixels, and the geographic location of these is available in a separate file.
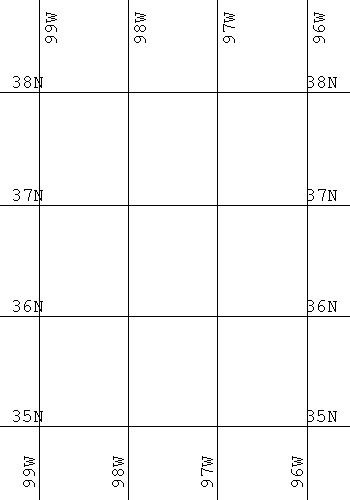
For SGP, the images are rectified to a Mercator projection, centered at the SGP Central Facility (36.605° N, 97.485° W). Each image consists of 500 lines of 350 pixels, and the pixel size is 1 km^2.
Data Stream Inputs
For the 1 km resolution images, these data streams are generated from AVHRR data supplied by the University of Alaska and SeaSpace in TDF format for the NSA and SGP respectively and from AVHRR data supplied by Aeromet at Kwajulain in McIDAS format for the TWP Nauru. The 1 km resolution images covering SHEBA were also supplied by the University of Alaska.
The University of Miami supplies the 4 km resolution TWP Manus and Nauru AVHRR and the 1 km resolution Kwajalein, Manus and Nauru AVHRR data in HDF format. Monthly Hovmuller diagrams are produced for each of the regions and for the lac and gac data.
Data Stream Names:
nsaavhrrX1.00
sgpavhrrX1.00
twpavhrrkwajX1.00
twpavhrrnnlacX1.a1.00
twpavhrrnngacX1.a1.00
Hovmuller diagram data streams:
twpavhrrnnlacsssX1.a1.yyymm00.000000.xxx.gif
where nn= 12, 14, 16, 17
sss = Manus, Nauru
xxx = lat, lon
Related Links
Office of Satellite and Product Operations Home Page
Advanced Very High Resolution Radiometer – AVHRR
NOAA KLM Users Guide
Prelaunch Channel Characteristics
NOAA Polar Orbiter Data User’s Guide
NOAA Response Functions
Description of ASDA Format
C Tool to access ASDA Format Files
Data Source
Institution
SGP
SeaSpace
NSA
Geophysical Institute, University of Alaska Fairbanks
GAC Coverage of TWP Manus and Nauru
University of Miami, Rosenstiel School of Marine and Atmospheric Science.
LAC Coverage of Nauru from Kwajalein
Aeromet
LAC Coverage of Darwin and Manus from Darwin
BOM
Data User Notes
Note A: Incorrect Data Type
There is a known bug in earlier versions of tdftohdf which gives the incorrect data type code, 23, unsigned short integers, instead of 22, for signed short integers. If you use this information in converting the values read from the files to geophysical units, the answer may be wrong as the sign bit is misinterpreted. This affects most of the data currently available through the ARM Archive. Use of the information given in the HDF file header (metadata) gives the correct values.
File Formats
Information on reading hdf formatted files can be found at: Reading netCDF, HDF, and GRIB Files
Lat/Lon Grid and Coastline Overlays
For the NSA, SHB, SGP and TWP matching sets of overlay files showing a latitude and longitude grid and the positions of the coastline and selected lakes and rivers are also available. The overlay files consist of an “image” of value 1 everywhere, except at the positions of the features in which case the pixel value is zero. Thus the overlays can be written into the image by multiplying them together; the image data remain unchanged and the overlain pixels become zero. The overlay images are in byte format.
Also available are HDF files (*lat-lonX1.00.hdf) that contain two arrays with the same dimension as the corresponding data-files, one of the latitude of each pixel, and the other the longitude. The images are distributed as short words, rather than bytes to preserve accuracy.
The various overlay files can be found through ARM Data Center.
Example Data
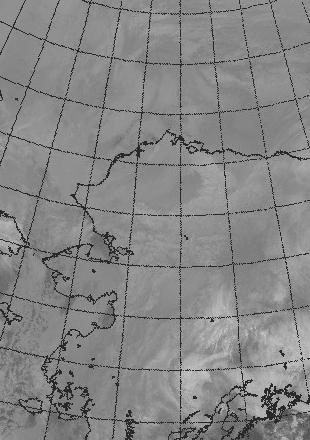
Quicklook Links
AVHRR images covering the North Slope of Alaska. These images were acquired by the University of Alaska and cropped to cover the NSA area. These are for channels 2 and 4 of the AVHRR on the NOAA 12 and 14 satellites. They are useful for qualitative information about the conditions at the NSA/AAO site.
Acronyms
ASDA    Australian Satellite Data Archive
AVHRR   Advanced Very High Resolution Radiometer
BOM     Bureau of Meteorology
GAC     Global Area Coverage
HDF     Hierarchical Data Format
LAC     Local Area Coverage
NOAA    National Oceanic and Atmospheric Administration
NSA     North Slope of Alaska
SGP     Southern Great Plains
SHB     SHEBA
SHEBA   Surface HEat Budget of the Arctic Ocean
TDF     Terascan Data Format
TWP     Tropical Western Pacific
Follow Us:


Keep up with the Atmospheric Observer
Updates on ARM news, events, and opportunities delivered to your inbox
ARM User Profile
ARM welcomes users from all institutions and nations. A free ARM user account is needed to access ARM data.


