Regime Analysis to Identify the Contribution of Clouds to Surface Temperature Errors in GCMs
Submitter:
Van Weverberg, Kwinten — Met Office
Area of research:
General Circulation and Single Column Models/Parameterizations
Journal Reference:
Science
Many Global Circulation Models (GCMs) exhibit a persistent bias in the 2m-temperature (T2m) over the midlatitude continents, present in weather forecasts and climate simulations. A number of hypotheses have been proposed, from deficiencies in the soil-vegetation-atmosphere energy exchange, to poorly resolved boundary-layer clouds, to misrepresentations of deep convection. This paper presents a new method to objectively disentangle and quantify contributions from clouds and other processes in the creation of the surface warm bias. A unique feature of this study is its focus on the temperature-error growth at the time-step level (dT2m-err).
Impact
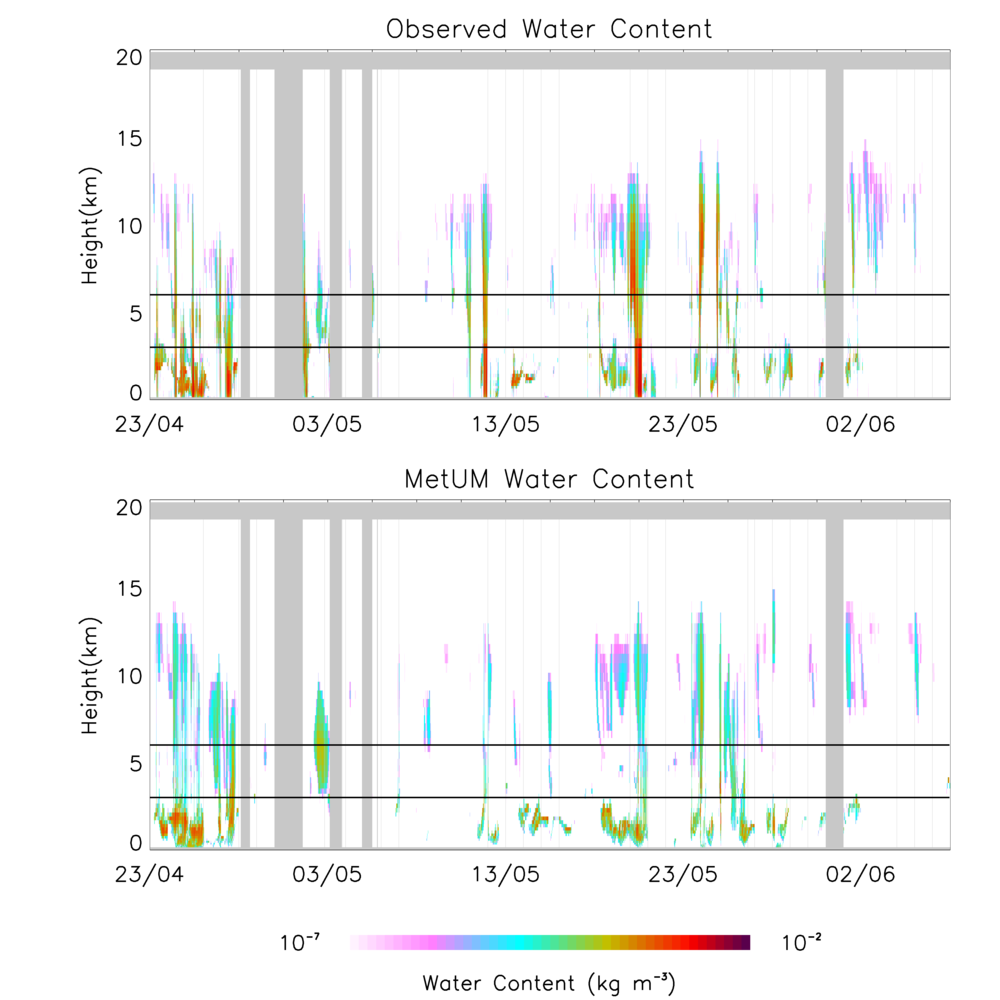
We applied this method to a simulation with the Met Office Unified Model (MetUM) GCM for the Midlatitude Continental Convective Clouds Experiment (MC3E) in the Southern Great Plains (SGP). Simulations were initiated every day at 00UTC and run for four days, similar to the Transpose-AMIP project. Observations from the ARM SGP Central Facility were used to evaluate the dT2m-err in the MetUM (e.g., Figure 1).
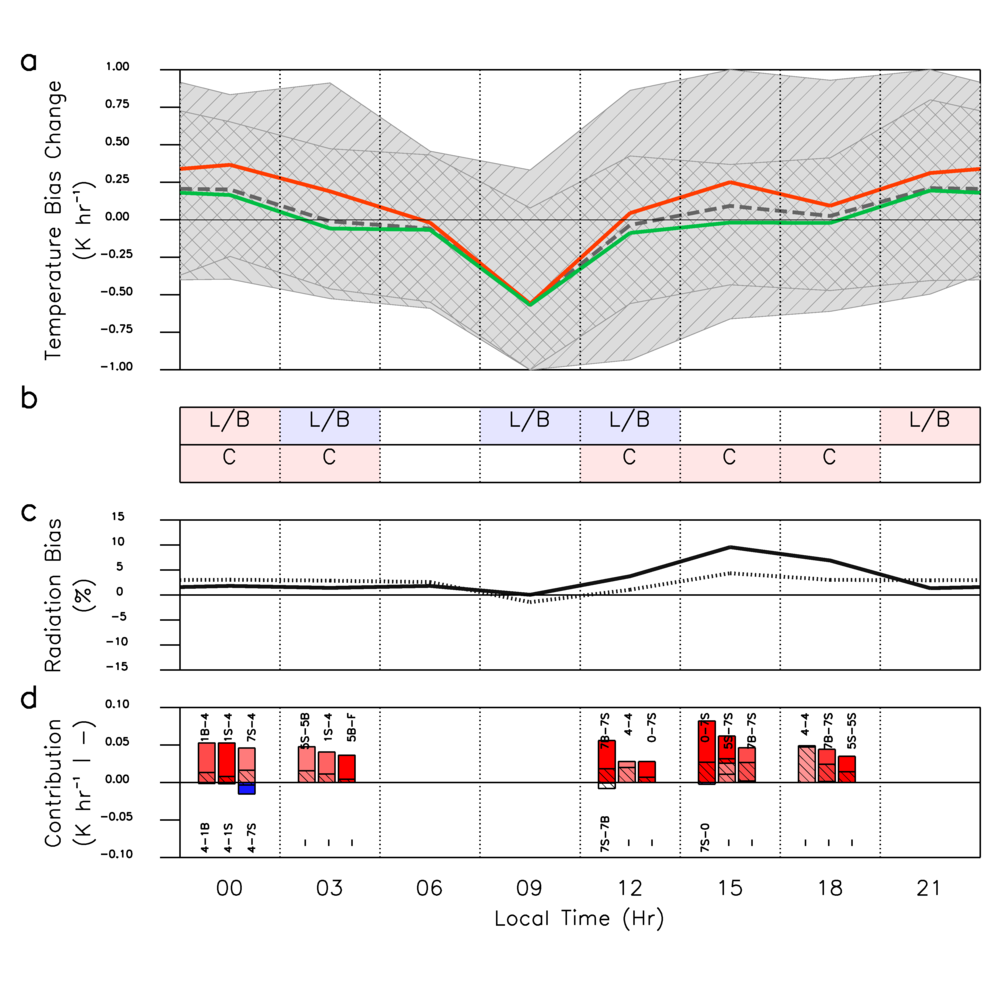
In the MetUM, the T2m bias typically appeared within a few hours after model initialization and exhibited a far larger fluctuation over a single diurnal cycle than the average growth over the 4-day hindcasts. Therefore, we focused the analysis on the origin of the diurnal dT2m-err behavior (Figure 2a).
The method consisted, first, of disentangling the role of clouds and other processes in the creation of the T2m bias for each three-hourly interval of the diurnal cycle (Figure 2a). All dT2m-err values in each time interval that were associated with coincident unbiased cloud radiative properties (no bias in the downwelling radiation) were assigned to a first composite (GR), while all dT2m-err values associated with coincident biased cloud radiative properties (bias in the downwelling radiation) were assigned to a second composite (BR). This enabled us to decompose the diurnal cycle of the dT2m-err into a cloud-related part (red line in Figure 2a) and a non-cloud-related part (green line in Figure 2a). If the dT2m-err for GR is significantly different from 0 (highlighted boxes in first row of Figure 2b), it follows that at least part of the dT2m-err is due to non-cloud-related deficiencies. Conversely, if the (absolute) dT2m-err for BR is significantly larger than for GR (highlighted boxes in the second row of Figure 2b), it follows that the dT2m-err preferentially grows during time steps with biased cloud radiative properties.
For the MetUM, it can be seen that the T2m bias decreased sharply in the morning (0730LT -1030LT). This decrease occurred regardless of coincident biases in the cloud radiative properties (green and red lines in Figure 2a) and was significantly different from 0 (blue highlighted box in Figure 2b). In the afternoon (1030LT-1930LT), the T2m bias started to increase. However, at this time, the dT2m-err in GR (green line) was not significantly different from 0 and nearly the entire dT2m-err occurred during BR-time-steps (red line). After sunset the bias continued to grow. In this case the dT2m-err in GR was significantly different from 0 (green line, 1st row of boxes in Figure 2b), but was significantly larger in BR than in GR (red line, 2nd row of boxes in Figure 2b). Hence clouds were almost entirely (partly) responsible for the dT2m-err in the afternoon (evening).
A second part of the method aimed to identify the cloud regimes responsible for cloud-related dT2m-err. Cloud regimes were defined based on cloudiness in three atmospheric layers. The absence of cloud was assigned a value of 0, while the presence of any cloud in the low, mid and high levels was given a value of 1, 2, or 4 respectively. The sum of the values of each of the three levels gives the regime number (0 = clear sky, 7 = deep cloud). Regimes with a low cloud base were split into broken (B) and overcast (S), giving 12 distinct cloud regimes. To find the main contributing regimes, the dT2m-err was composited by the coincident simulated-observed regime pair. Figure 2d provides the 3 top contributing regime pairs for each 3-hourly interval. The height of the colored box gives the portion of the dT2m-err in Figure 2a (red line) for the regime pair in question, defined as frequency × magnitude of the dT2m-err of the regime pair.
From Figure 2d, the dT2m-err in the afternoon was mainly due to missing or under-representing regime 7 in the MetUM (mainly associated with deep convective storms). During the night, the main culprit for the dT2m-err in BR (red line in Figure 2a) were too-abundant low-level clouds in the MetUM (1B, 1S, 5B, or 5S) instead of the observed high clouds (4).
Summary
The method was also applied to the CAM5, attributing the dT2m-err to a lower-than observed albedo and too-persistent deep clouds in the evening. This paper is intended as a description of the method that will be applied during the Clouds Above the United States and Errors at the Surface (CAUSES) project, aimed at studying surface and cloud-related factors that contribute to the warm bias in many GCMs.