Cloud-Resolving Model (CRM) Simulations: Robust Results for Use in Climate Model Development
Submitter:
Fridlind, Ann M. — NASA - Goddard Institute for Space Studies
Mrowiec, Agnieszka Anna — Columbia University/NASA Goddard Institute for Space Studies
Area of research:
Cloud Processes
Journal Reference:
Science
Climate model grid meshes are too coarse to explicitly simulate storm system winds and therefore must rely on simplified models referred to as parameterizations to represent all storm properties and effects. Cloud-resolving models (CRMs), on the other hand, are run over smaller domains and for short time periods and can explicitly resolve the wind circulations within storm systems. For decades CRMs have been an important tool to help evaluate and improve climate model parameterizations. However, CRMs still contain parameterizations, such as simplifications of the properties and behavior of hydrometeors (cloud droplets, raindrops, ice crystals, snow, graupel, and hail). CRMs therefore themselves remain unreliable to an unknown degree, owing at least in part to large remaining uncertainties in the representation of such microphysics. Here we address the following question: which CRM results are robust to basic changes in microphysics and dynamics schemes, and therefore most reliable to guide climate model parameterization development?
Impact
In this study we analyze the properties of three differing simulations of a strong mesoscale convective system observed in the tropics during the 2006 TWP-ICE field campaign. The simulations include one simulation that does not predict droplet number concentration and two that do (this is an important aspect of microphysics). The latter two simulations also differ in their so-called dynamical core, meaning that their numerical representation of winds may differ, among other factors. As an aside, we note that the simulations that do predict droplet number also used an aerosol size distribution profile based on observations gathered during TWP-ICE.
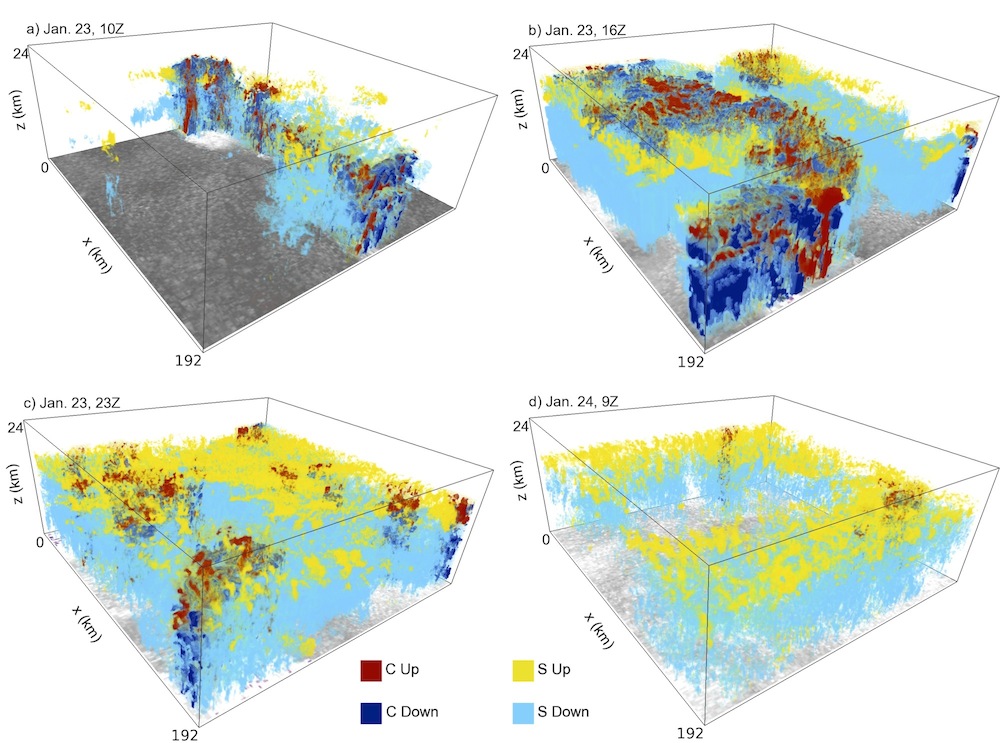
The first task is to identify a comparison framework. Climate models and observational studies have commonly divided large storms into convective precipitating regions, which are associated with strong updrafts and variable, heavy rain; and stratiform precipitating regions, associated with weak updrafts and uniform, weaker rain rates. This separation into convective and stratiform rain can be viewed as the most fundamental structural feature of well-developed storms. Also, climate model parameterizations are commonly based on mass fluxes within updrafts and downdrafts. We therefore further focus primarily on the mass fluxes and properties of updrafts and downdrafts in the separate convective and stratiform areas, as illustrated in Figure 1.
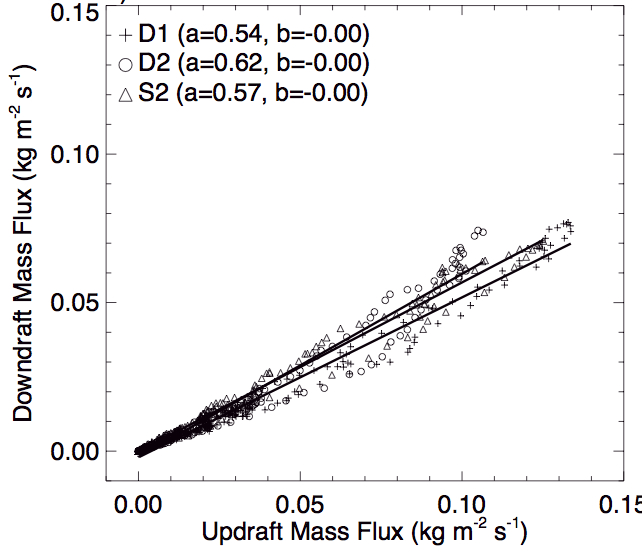
After partitioning precipitating areas in each simulation into stratiform and convective regions based on calculated radar reflectivity, we identify updrafts and downdrafts using a variable wind strength threshold that is calculated to independently capture 90% of mass transport by updrafts and downdrafts separately in each region. In climate models with convective parameterizations based on mass fluxes, it is often assumed that the downdraft mass flux is a fraction of updraft mass flux, typically assumed to be a constant number between 0.25 and 0.5. Domain-averaged downdraft versus updraft convective mass fluxes at each time step are shown in Figure 2. During the period analyzed, all simulations do in fact show a remarkably linear relationship between the convective updraft and the downdraft mass fluxes, and the convective downdraft mass flux is about 0.5 to 0.6 of the updraft mass flux. We interpret this as an evaporation efficiency, indicating that roughly half of condensation in convective updrafts is evaporated in convective downdrafts. This monsoon storm case is likely at the higher end of evaporation efficiency since the environmental air around the storm is moist (drier environmental air would be associated with higher evaporation rates, all else being equal).
Summary
The greatest difference across the simulations is in the partitioning of ice among different types, which appears to depend primarily on the microphysics scheme, consistent with known uncertainties in microphysics parameterizations. However, a consistent pattern is seen across the simulations insofar as the slowest-falling ice hydrometeor type (cloud ice) is roughly 90% as abundant in the stratiform regions as in the convection region, whereas the fastest-falling hydrometeor type (graupel or hail) is least abundant. Although hydrometeor mass loadings differ, as do the properties of cold pools of air that form beneath downdrafts, several commonalities are remarkably consistent across simulated convective regions. First, both convective updraft and downdraft mass fluxes are nearly linearly correlated with convective area. Second, the ratio of ice in convective downdrafts to that in updrafts is about 0.5, independent of ice species. Third, the ratio of downdraft to updraft mass flux is about 0.5–0.6, as shown above. In follow-on work, we are extending these analyses to evaluate assumptions in the quite different convective parameterizations of two current climate models.