
From instruments to archives, terabytes on Sun, Clouds, Wind, and Gases
In the sky over the Azores, in the remote Atlantic Ocean, a bank of clouds dips toward a radar on Graciosa Island. Data point.
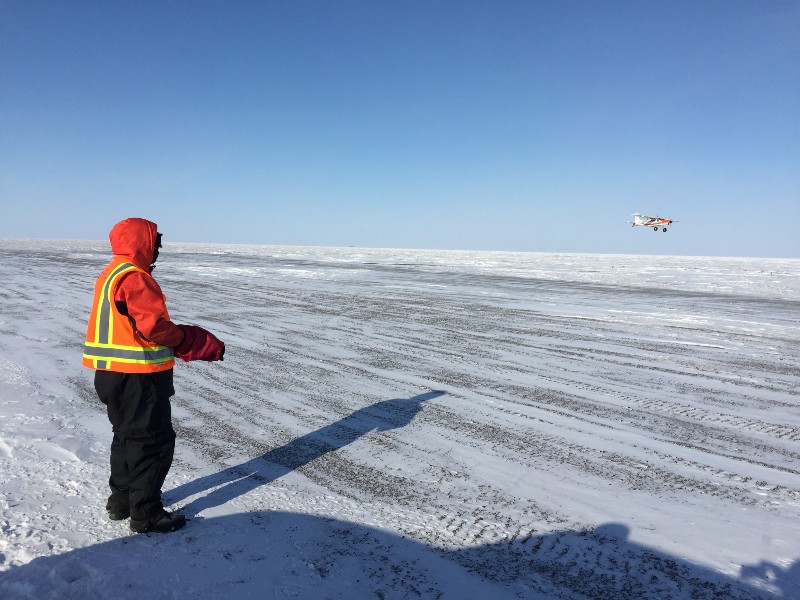
In Oliktok, Alaska, arctic sleet patters against a sensor. Data point.
Near a wheat field in flat central Oklahoma, an airborne particle falls into a recording device. Data point.
Measured in great numbers over long periods of time, fleeting phenomena like clouds, precipitation, and airborne particulates become terabytes of data that, when filtered through models, provide scientists with a portrait of Earth’s changing climate.
All those data points from the Azores, Alaska, Oklahoma, and elsewhere have an important place to go: the carefully maintained climate information archives of the multi-laboratory Atmospheric Radiation Measurement (ARM) Climate Research Facility, a U.S. Department of Energy effort in place since 1990. The ARM mission was (and still is) to collect continuous, 24-hour, real-world, climate-relevant data “of known and reasonable quality.” In turn, scientists can test their predictive climate models against observational data streaming in from the sun, clouds, wind, atmospheric gases, and Earth’s surface.
Today, ARM has 400 field instruments, with an average of 330 in operation on any given day. These radars, lidars, counters, and other devices generate data that are sent over the internet, or sometimes shipped by air in hard drives. Data are processed, compressed, quality checked, archived, and then sometimes repackaged into high-end data products available to end users, often by the next day. (Raw data are archived too.) All this includes not only geophysical data, but data about the instruments themselves.
At the end of all those steps emerges “state-of-the art data (from) over a long period of time,” said University of Washington climate scientist Robert Wood, an ARM data user since 2007. He is science team leader for the Eastern North Atlantic (ENA) ARM site on Graciosa, where observations began in 2013, and where data originate from nearly 40 instruments.
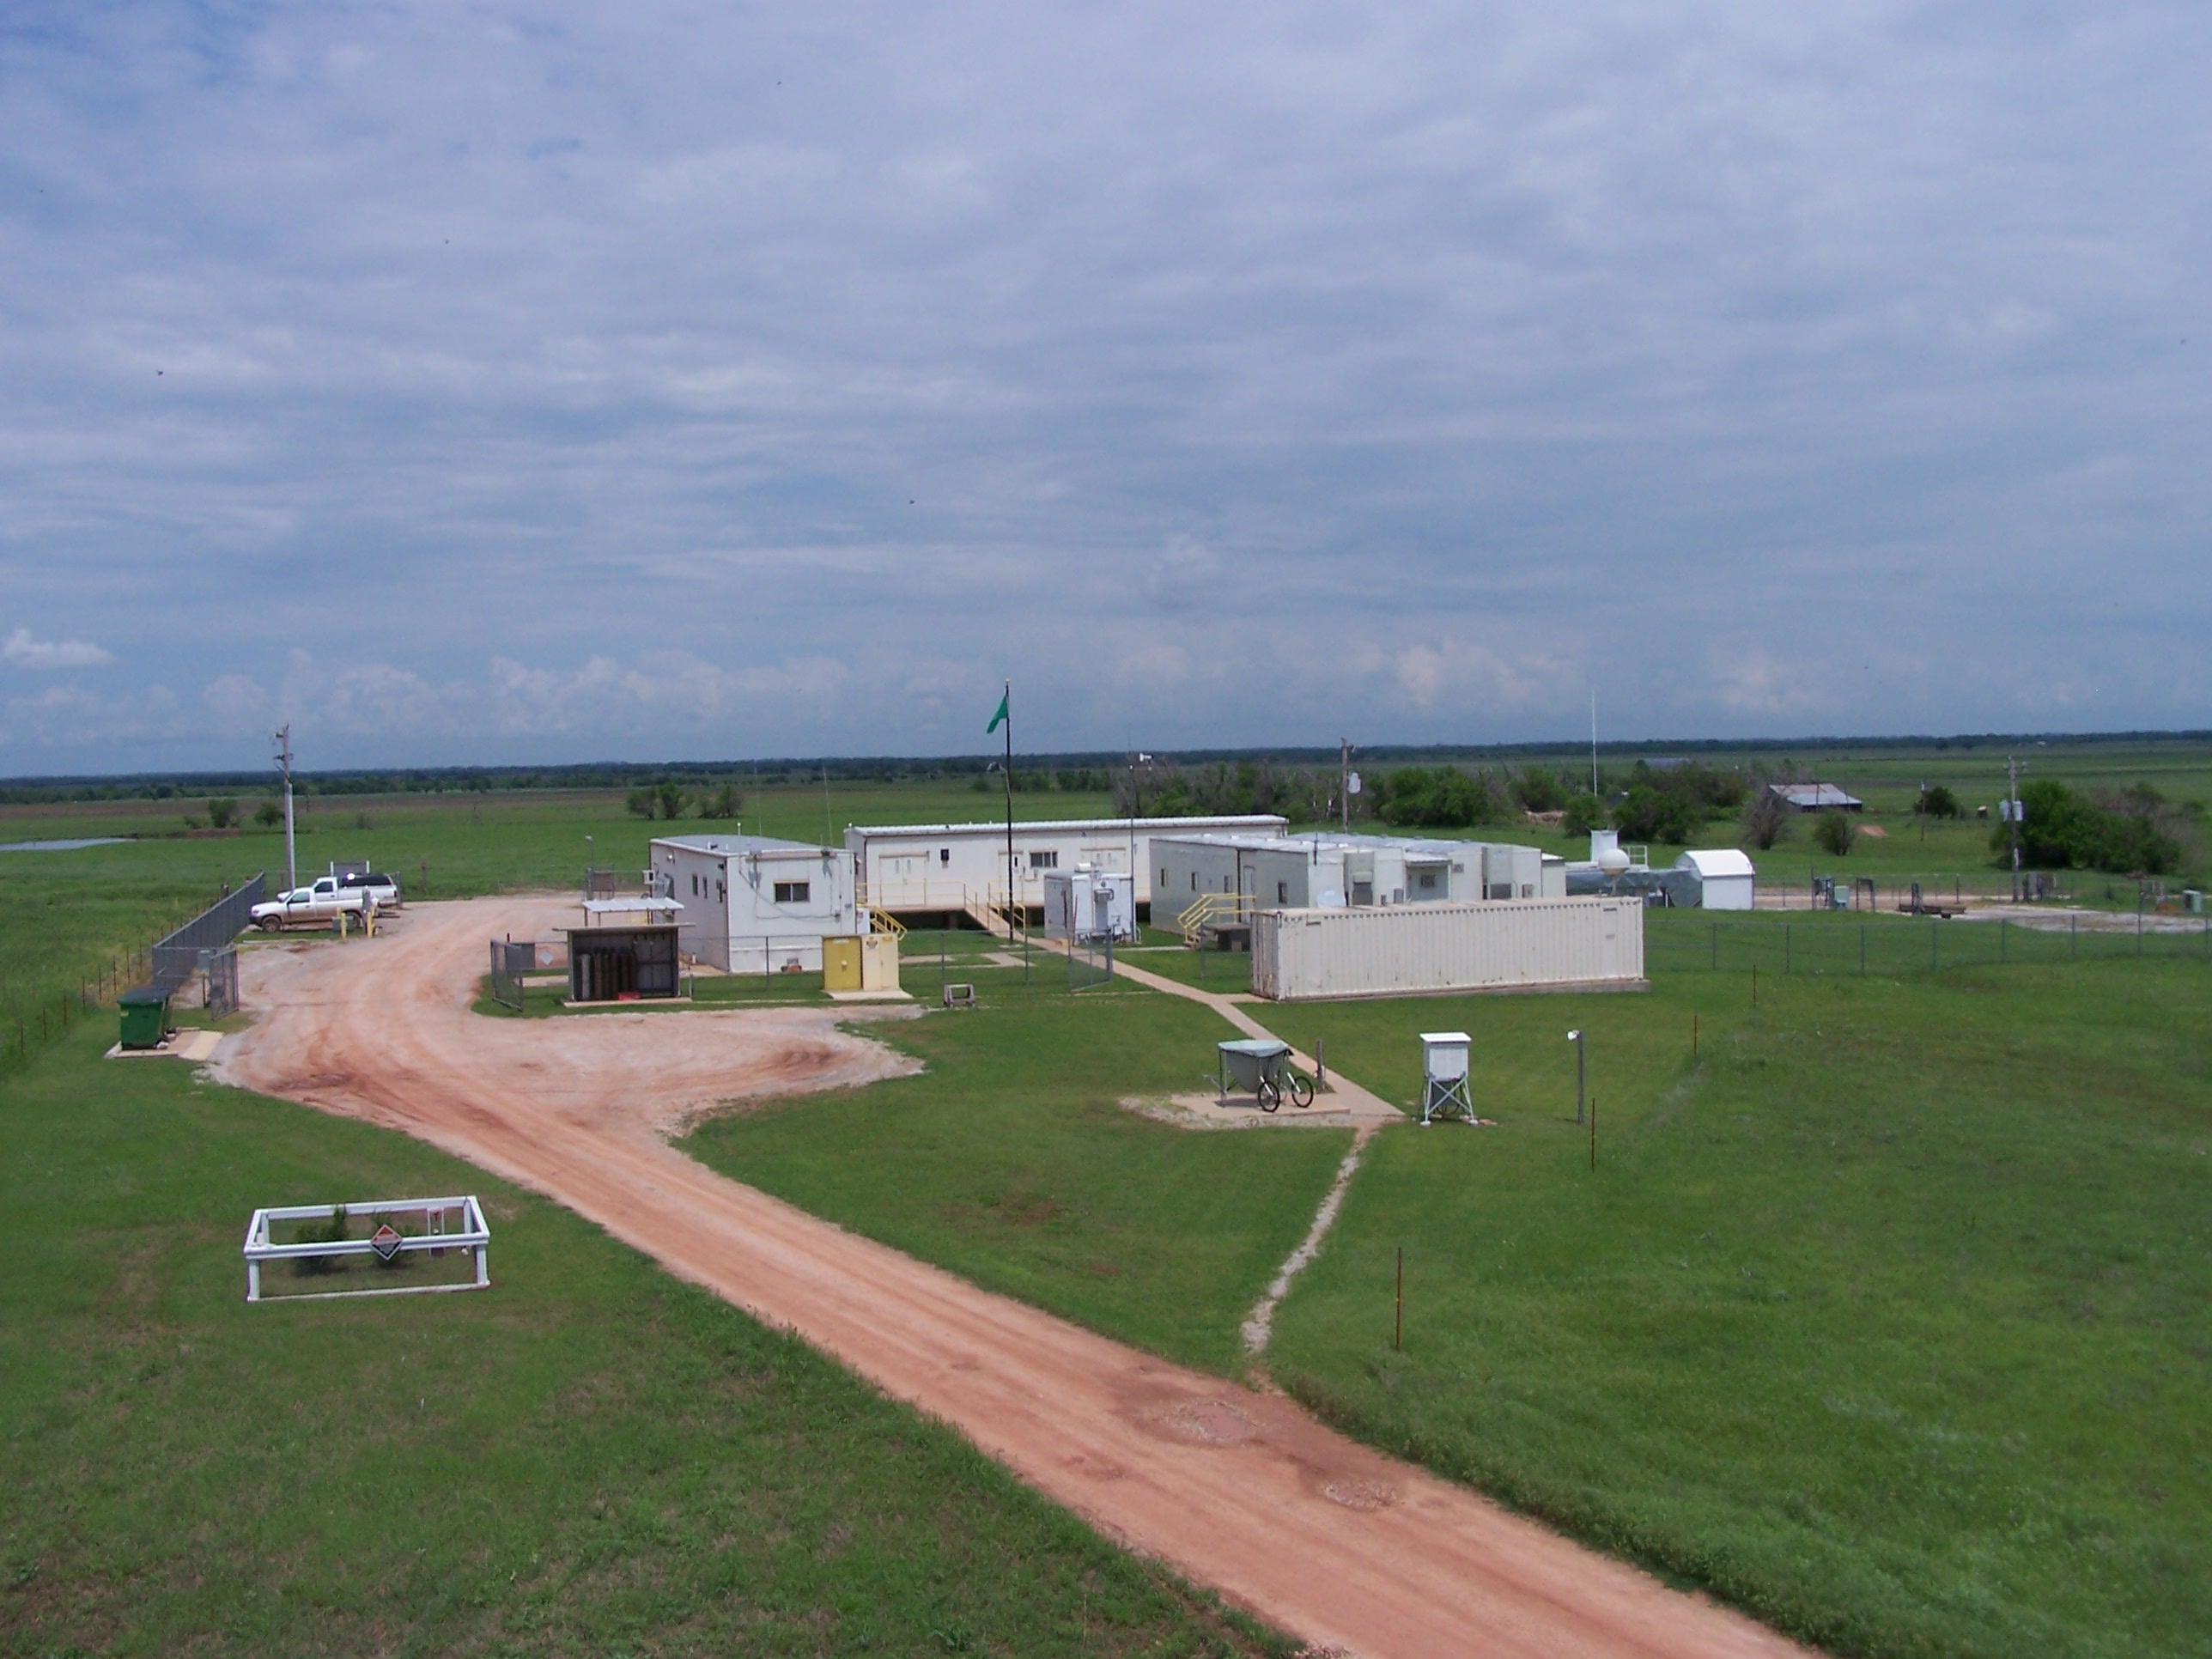
The ARM Facility has been collecting and storing climate-relevant information since 1992, when its first instruments were arrayed at the Southern Great Plains site.

Out in the Elements, the Instruments
For a few days in July, University of Wisconsin-Madison research scientist Jonathan Gero was at the ENA site on Graciosa Island to install an Atmospheric Emitted Radiance Interferometer (AERI). He is ARM’s instrument mentor for that device and keeps track of nine. AERI detects infrared radiance that propagates downward from the atmosphere.
By the end of the third day, the AERI was installed, calibrated, and already taking in operational data. (ARM has 20 years of AERI data so far, which indirectly helps track trending levels of carbon dioxide at the Earth’s surface.)
That AERI is now part of a familiar process for most instruments at sites that have reliable internet connections. Data moves from the instrument computer to site data storage and then on to the United States, creating a pulse of new data once an hour.
And Gero had begun again what is routine for all ARM instrument mentors: to monitor both the health of the instrument (usually remotely) and to check its data for quality. (Among other things, mentors write DQRs, or data quality reports, which record changes or errors.)
Gero and others will say that sometimes nature gets in the way of collecting data. Wind, rain, and other elements take their toll on instruments, which are maintained by site technicians. Cows use instruments as rubbing posts, birds build nests in cozy ARM shelters, and so do spiders, rodents, and hornets.
For two weeks straight once, the same bird at the same time of day pecked at a Total Sky Imager sited in Alaska. There is a 30-second daily “movie” of it, since the instrument’s datastream includes daylight time-series images of the hemispheric sky. That memorialized bird is also a reminder that ARM measures more than aerosols and temperatures; it records images, years of movies, and thousands of interactions with nature.
By the Terabyte, the Data
It’s a minor note in her big job, but Nicole Keck reads the animal reports at her desk at the Pacific Northwest National Laboratory (PNNL) in Richland, Washington. She oversees the Data Management Facility (DMF), the next step in the ARM data flow process. After all, the status of each instrument is part of the 20 terabytes of raw climate data that come her way in near-real time every day, she said, even if one datum is “Fox chewed through cable.”
Keck manages a staff of three located at both PNNL and Oak Ridge National Laboratory (ORNL) in Tennessee. Most data arrive in hourly chunks over the internet. They are converted and compressed by automated codes called “ingests” into a Network Common Data Form (NetCDF), a widely used machine-independent and self-describing open source format.
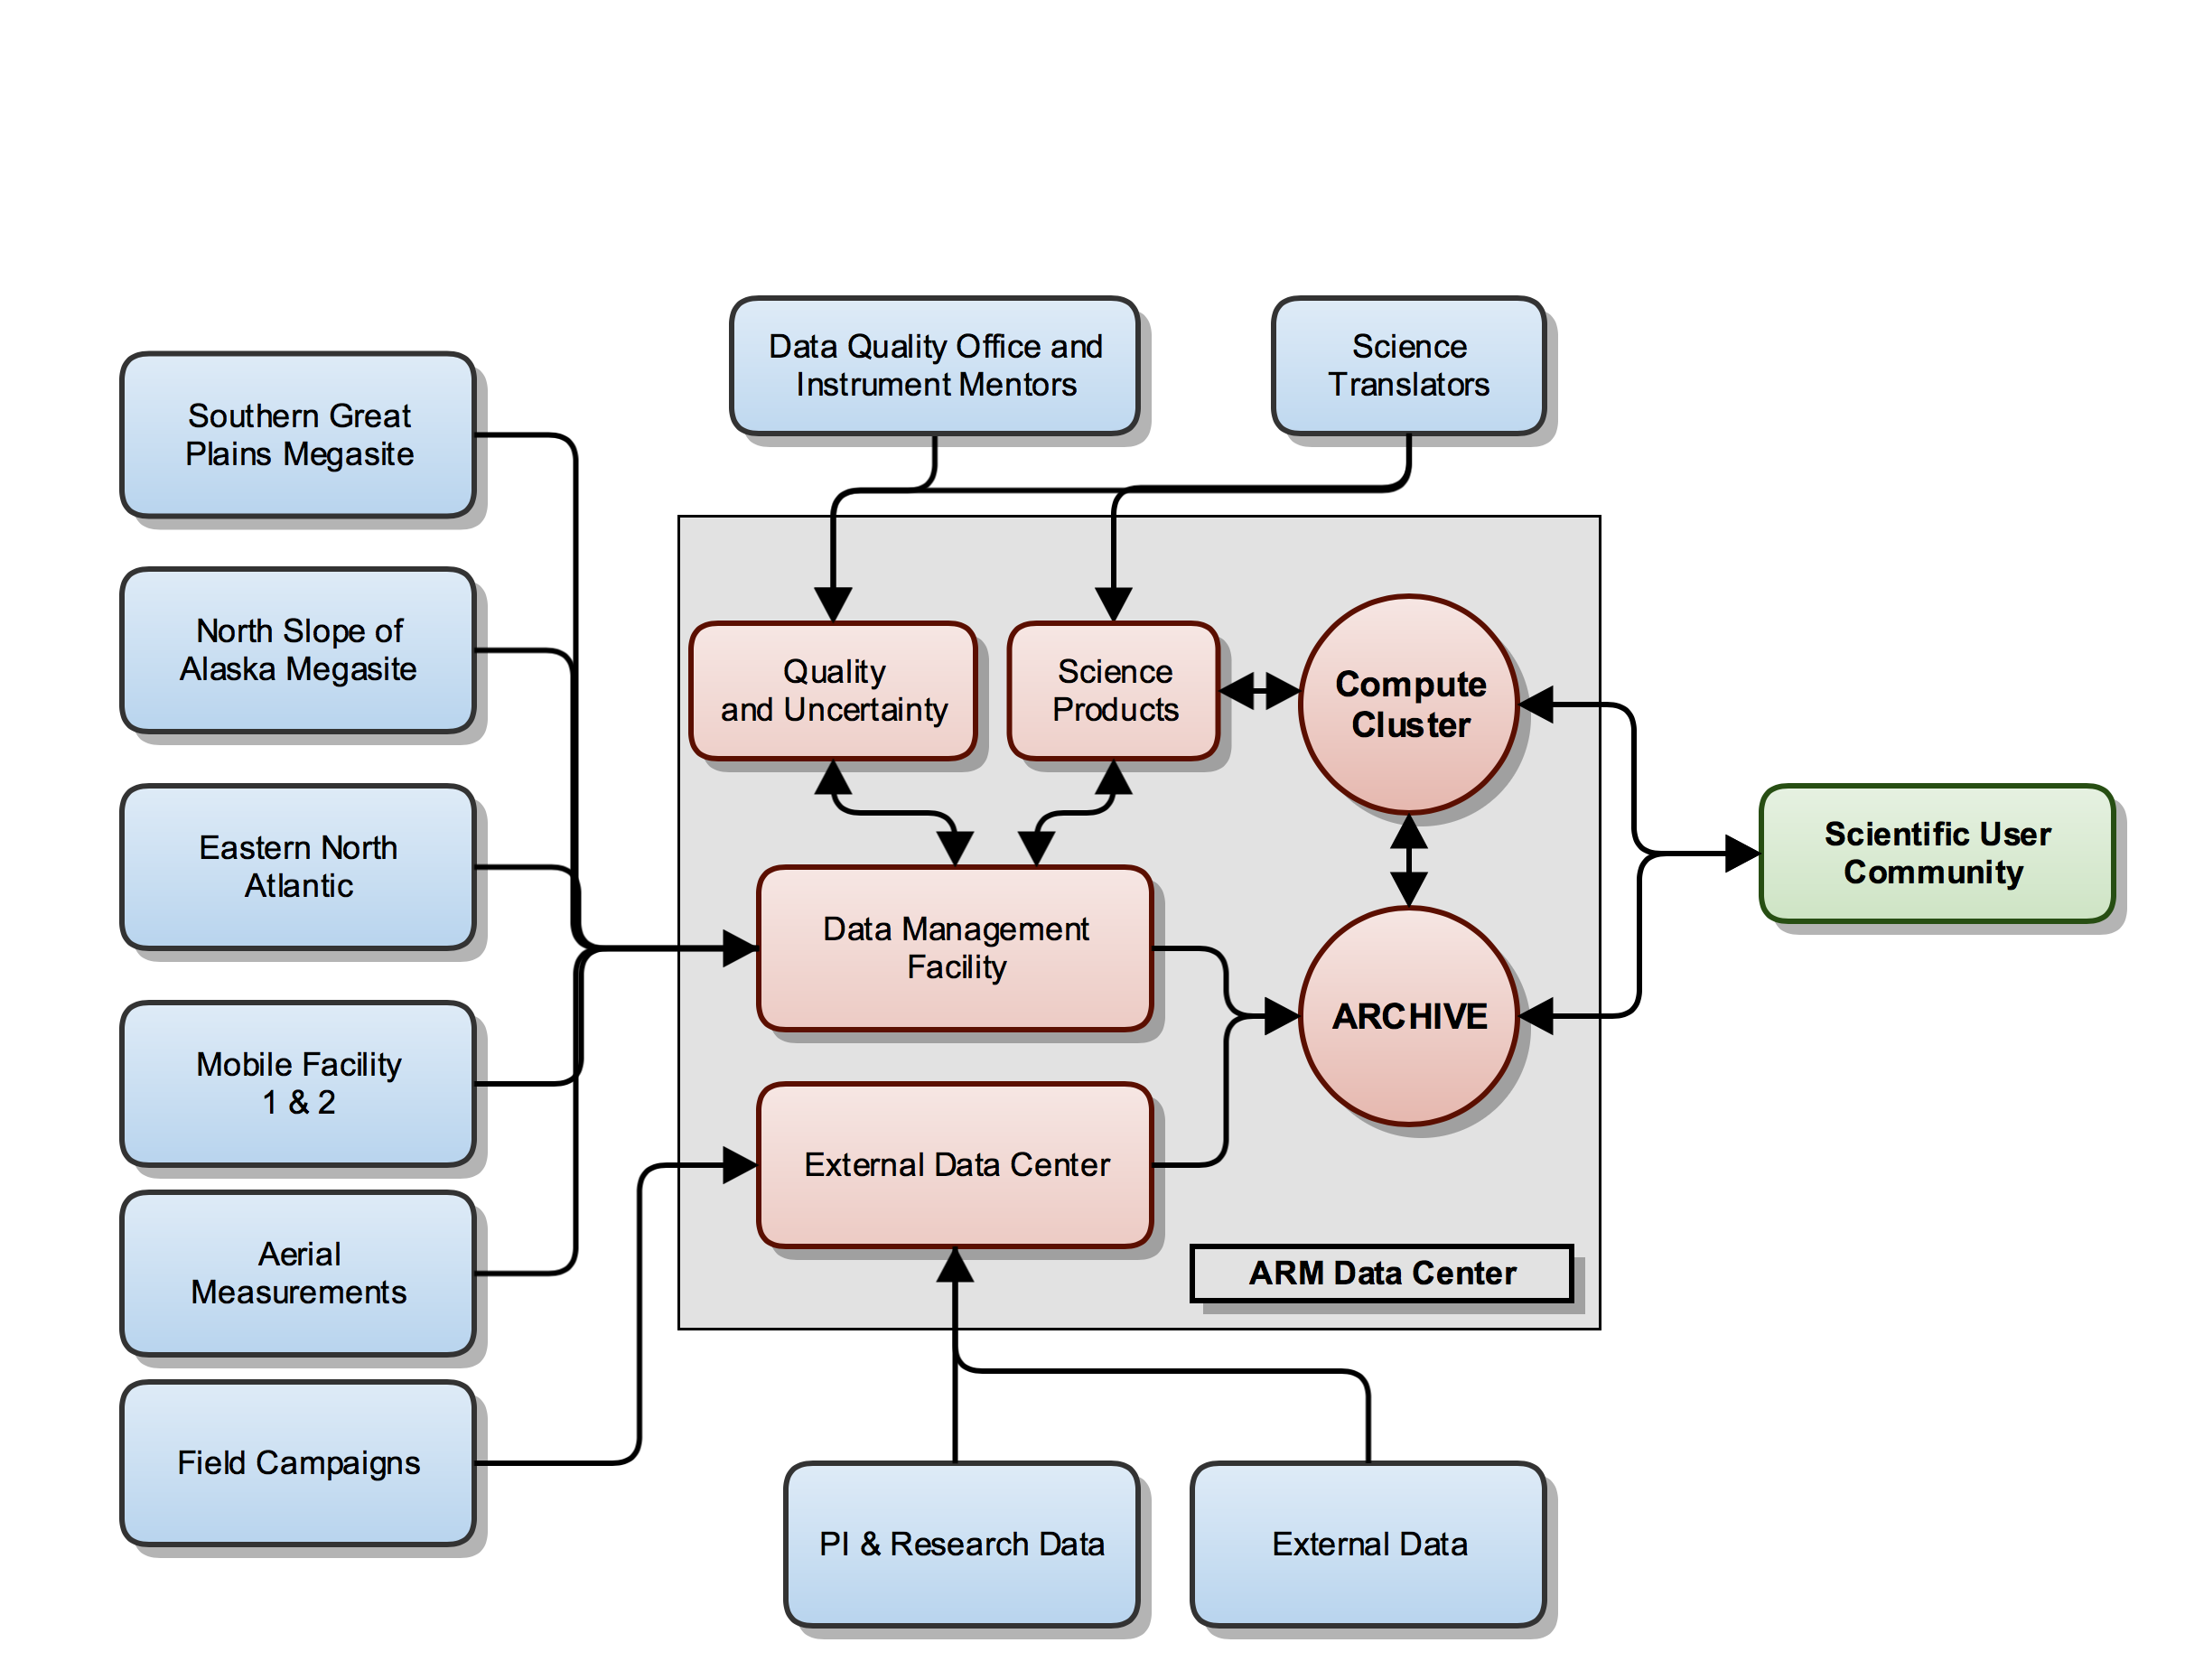
The data are cleaned, filtered, and compressed by analytical web tools—catching, for instance, a format change in the raw data. The compression, which makes data more accessible, is dramatic. During the April-June quarter this year, the DMF took in 6.3 million files of raw data, or 117 terabytes, and compressed them to just over 330,000 files, or 38.6 terabytes. “Our systems,” said Keck, “are constantly running.”
Some data from remote sites have to be downloaded into 500GB external drives and shipped by air: twice a month from the North Slope of Alaska site, as weather allows, or once a month (summers only, usually) from two sites during the 2015-2017 ARM West Antarctic Radiation Experiment.
At the PNNL site, data scientist Chitra Sivaraman oversees the creation of VAPs, or value-added products. “Sometimes scientists need more than they measure,” she said.
VAPs, an important source of ARM data, create new datastreams by combining observations from different instruments, or even from models. If an instrument measures radiative transfer, for example, but scientists also want information on liquid water path, an algorithm is applied to interpret the data. (Liquid water path is a measure of the weight of liquid water droplets in the atmosphere, important to understanding radiative transfer.)
VAP software has to be robust and reliable enough “to run in an automated way at multiple sites and facilities, with inputs from diverse sets of instruments,” said Sivaraman. “We think of all the things that could go wrong. VAPS become complicated very quickly.”
ARM processed data through its first VAP in 1993; now there are 82, along with nearly 1,400 VAP data sets. All are subject to constant quality checks and updates.
All eventual data—raw, processed, and value-added—go through a series of checks in coordination with ARM’s Data Quality Office. Only then can the “file integrity” of the data be certified before transmission to the archive, where end users have access.
Keck has been to most of the national laboratories, but has visited just one ARM site. Still, after 16 years of collecting and smoothing data vital to understanding climate change, “I feel like I’m doing something to contribute an answer, through science,” she said. “The impact is global. It’s not just data from one satellite in one corner of the world.”
Tight and Tough, Quality Checks are Next
At the ARM Data Quality Office (DQO), research associate Kenneth Kehoe feels the same about his job. Day to day he works with scientists, (“That’s awesome”) but he also gets to see the big picture. “You have the ability to work on a project seminal to our time,” said Kehoe of climate change science. “This is the most important thing in human history.”
DQO, headquartered at the University of Oklahoma, opened in July 2000 to assure data quality as the ARM Facility matured and its datastream broadened. (Managing the office is geographer and atmospheric scientist Randy Peppler.) DQO works with ARM measurement infrastructure, science team members at Atmospheric System Research, and with climate science users. With five full-time staff and as many as nine undergraduate interns a year, the DQO develops and implements data-quality algorithms in an era of rapid change in instrument and computer technology. It runs continuous checks of ARM data quality, analyzes results, and reports them to ARM and to the broader user community.
ARM instruments annually collect hundreds of instrument-years of data. Every hour of every day, the results are collected and analyzed, then assembled into a color metric of data quality on the DQ Office Toolbox site. About 6,500 data plots are created each hour by automated software, and can be browsed by timeframe and instrument.
All the data are gathered into 24-hour metrics based on UTC, or Universal Time Coordinated, the successor to Greenwich Mean Time. “The intent of this is to give a really good snapshot,” said Kehoe, who works from an office in Boulder, Colorado.
Checking science data quality is punishing, detailed, and gritty work but assures that data meet the ARM standard of known and reasonable.” After all, “Good enough is not good enough,” said Kehoe, who in 12 years has developed a sense of the field instruments from the data they deliver and the challenges they face in the elements.
“We look at all the sites and all the instruments. We’re the first line of defense for data quality in the program.”
Someone has to check all the bits and bytes that climate models eventually depend on. “It’s the job few people want to do,” said Kehoe. “But it’s fundamental to science.”
Storage of Many Layers, Access of Many Kinds
Staffers in the DQO, no matter where they work, log on to computers at Oak Ridge National Laboratory (ORNL), the national lab in Tennessee. It’s the main home of ARM’s massive archive of long-term climate data. Everything is stored there: data that are raw, processed, and reprocessed. Every change is saved. Whatever is stored is backed up for archiving at three other sites as well.
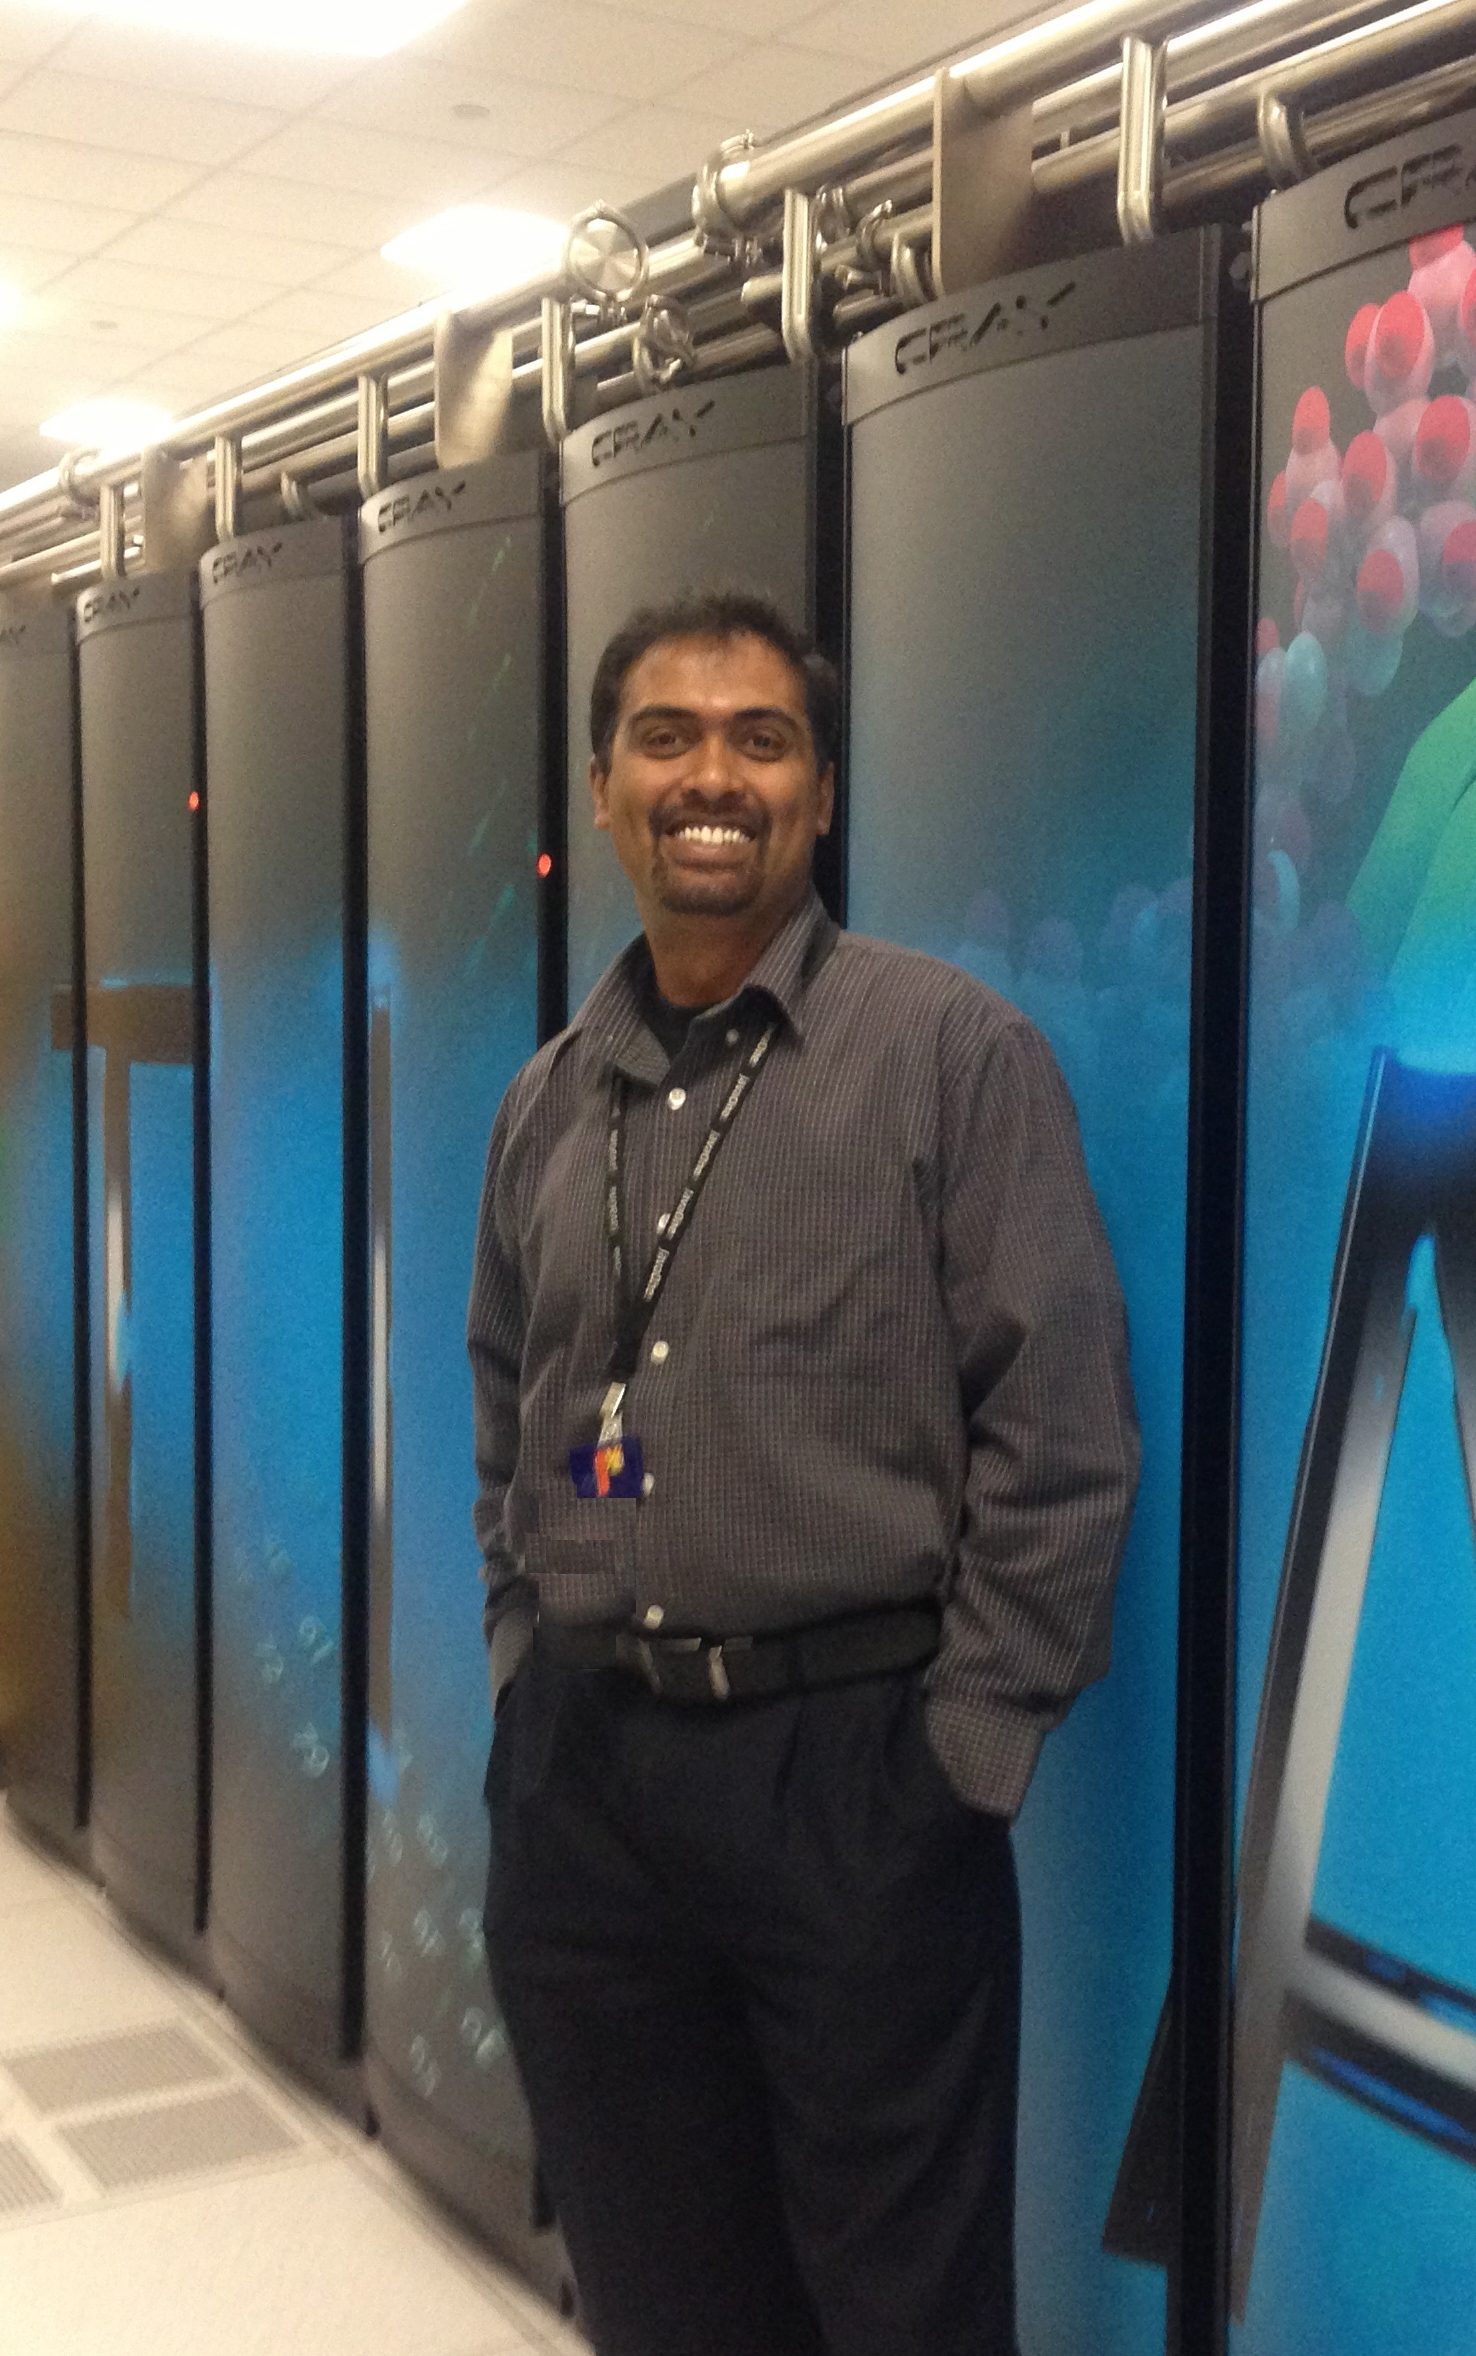
ORNL is where you will find Giri Prakash, who wears many hats. He is Data Services and Operations Manager at the ARM Data Archive, and oversees the DMF, Site Data Systems (used to collect and transmit instrument data), and the External Data Center (XDC).
The XDC, located at Brookhaven National Laboratory, collects and reformats atmospheric data on behalf of ARM from outside agencies and sources, including from models and satellites. Data products from ARM field campaigns and principal investigators are also delivered to the XDC before transfer to the ARM Data Archive for distribution.
The XDC also manages the scientific and operational tagging of data (metadata), said manager Alice Cialella. “Metadata touches all stages of the data, starting with the initial collection from the instrument through to downloading processed data from the ARM Data Discovery Tool.”
In various internet and disk storage systems, the ARM Data Archive at ORNL keeps about 820 terabytes of raw, processed, and value-added data. There are more than 10,000 data products, which are one or more physical measurements bundled into a package.
Researchers use a web-based system to browse different holdings, including the Data Discovery Browser to search for data by scientific hierarchy. Under “atmospheric state,” for instance, they can progress to “surface meteorology,” and from there to data on temperature, pressure, moisture, and other factors.
“It’s a way of drilling down to the measurement you want,” said Prakash. “It’s like looking for a camera on Amazon.com.”
Data coming into the archive are verified for formats searchable to scientists. Then they are stored in four places: “deep storage” in a high-performance storage server at Oak Ridge; in shared storage at the ARM Data Center, where the most frequently requested data reside; in a backup facility two miles away, where tapes hold up to six terabytes each; and in yet another data backup site at Argonne National Laboratory near Chicago.
Like many workers within the ARM data process, Prakash has never visited a field instrument site. But he travels widely to assess the user experience, to pursue next-generation data storage strategies, and to give talks on how to discover ARM data.
“It’s my passion,” he said of managing climate data. “This is big science we are supporting.”
# # #
The ARM Climate Research Facility is a national scientific user facility funded through the U.S. Department of Energy’s Office of Science. The ARM Facility is operated by nine Department of Energy national laboratories.