CCN and Vertical Velocity Influences
Submitter:
Hudson, James G. — Desert Research Institute
Area of research:
Cloud-Aerosol-Precipitation Interactions
Journal Reference:
Science
Cloud microphysics and cloud condensation nuclei (CCN) spectral measurements from two summertime aircraft cloud research projects off the central California (CA) coast—Marine Stratus/Stratocumulus Experiment (MASE) and Physics of Stratocumulus Tops (POST)—are presented and analyzed. MASE was always polluted (high CCN, Nc (NCCN), and droplet concentrations, Nc), while POST had clean (low NCCN and Nc), polluted, and intermediate concentrations.
Impact
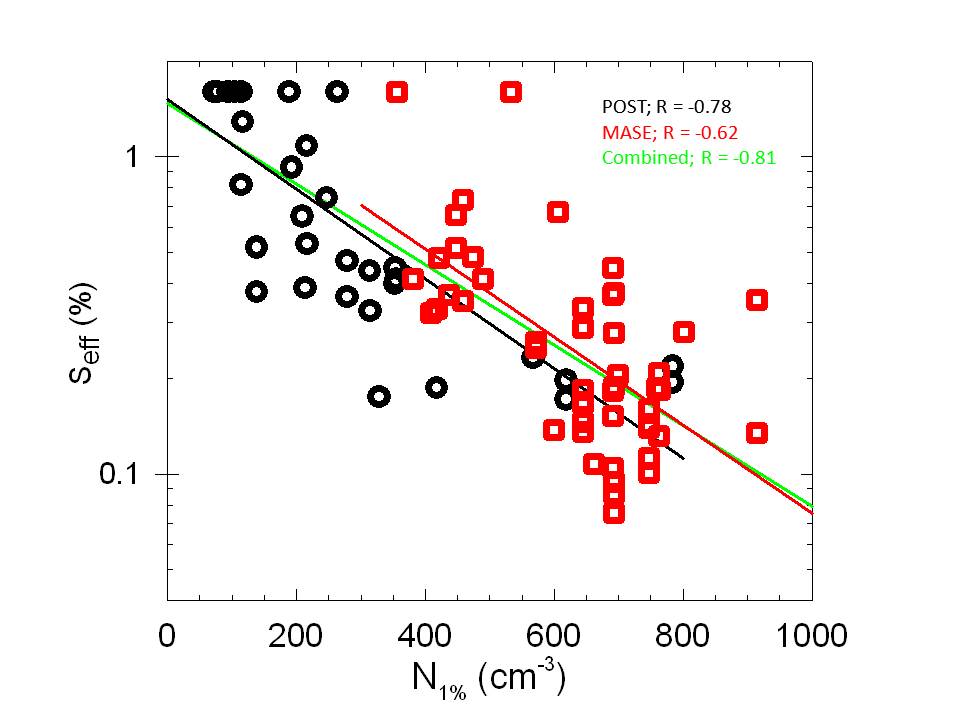
Both projects show the suppression of cloud supersaturation (S) by higher CCN concentrations ( NCCN) shown in Figure 1. POST showed a strong positive correlation between NCCN and Nc (correlation coefficient, R = 0.86) but MASE showed this R to be -0.36. Vertical velocity (W) also influences Nc-. W was positively related to Nc in POST (R = 0.60), while the standard deviation of W (δW, which is thought to be more pertinent to stratus clouds) was positively related to Nc (R = 0.51) in MASE.
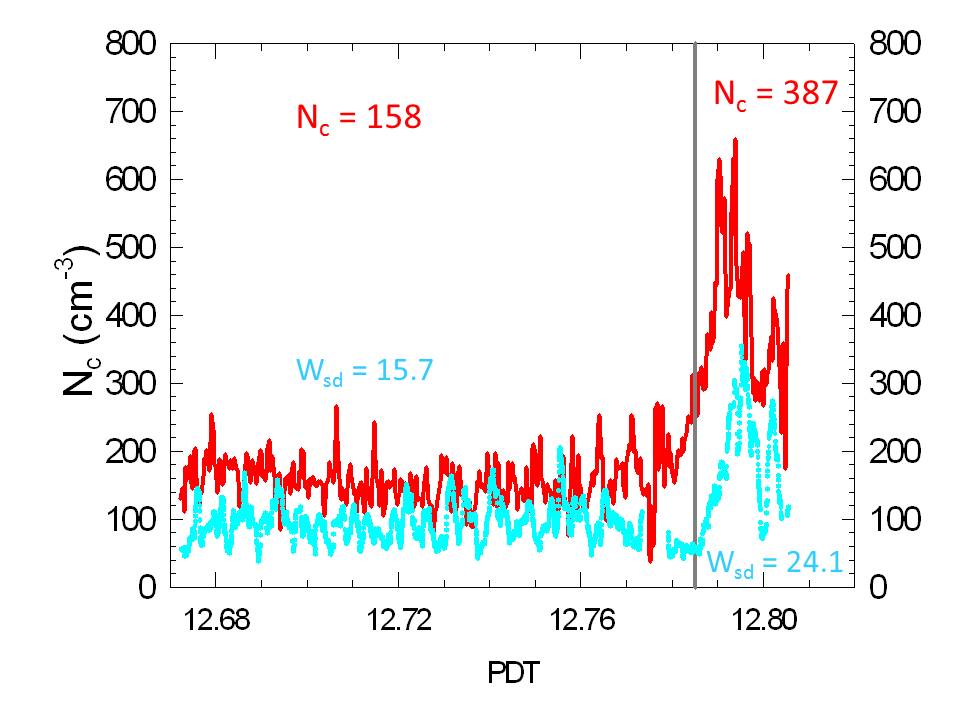
Six POST and 12 MASE cloud penetrations showed abrupt district divisions in terms of Nc and W (POST) or δW (MASE), as displayed in Figure 2. These divided penetrations demonstrated the influence of W or δW on Nc because all 12 of the MASE divided cloud penetrations showed significantly higher δW and Nc within the same divisions of these clouds than the adjacent divisions with lower Nc and lower δW, as shown in Figure 2.
Twomey (1959) demonstrated that the relative influences of NCCN and W on Nc depends on the slope of the CCN spectra. When the slope (k) of the cumulative CCN spectrum is low (shallow), NCCN variations have more influence on Nc than W variations. When k is high (steep; greater differences in NCCN for the same S differences), W variations have more influence on Nc. CCN spectra generally show systematic variations of k over S; k decreases with S. At high S (~1%) k is low (<0.3) and at low S (< 0.1%) k tends to be high (~1.0). High S in cleaner air masses such as POST ( NCCN < 400 cm-3 in Figure 1) result in greater influence of NCCN on Nc. Hence, the high R for NCCN-Nc of POST (0.86). The low cloud S (~ 0.1%) that is forced by higher NCCN (Figure 1, > 600 cm-3), such as was often measured during MASE, makes relevant only the high k of the CCN spectra that is usually observed at or below 0.1%. This makes δW variations more influential to Nc than NCCN.
Summary
Clean stratus clouds are more greatly influenced by CCN concentration differences than by vertical velocity differences, but polluted stratus clouds are more influenced by vertical velocity variations than by CCN concentration variations. This seems to put a limit on the indirect aerosol effect because very high CCN concentrations do not have as much influence as otherwise expected. This also provides plausibility for the negative R for NCCN- Nc observed in MASE.
Twomey, S. 1959. “The nuclei of natural cloud formation, II; The supersaturation in natural clouds and the variation of cloud droplet concentration.” Pure and Applied Geophysics 43: 243-249.