

Location, Location, Location… Field Campaign Focuses on Latitude Effects
Published: 15 January 2006
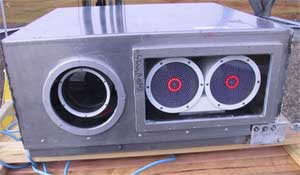
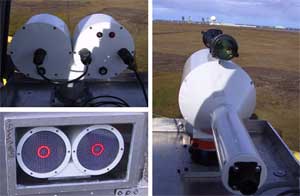
![A scintillometer was used to detect atmospheric optical disturbances-called scintillations-caused by temperature, pressure and humidity. The instrument emits light from two transmitters, shown at left. The light traverses the local atmosphere, perturbed by density fluctuations. Some of the light enters the receiver, shown at right. (Image from Scintec at [http://www.scintec.com][www.scintec.com].)](/images/imported/scintillometer.jpg)
In September 2004, a reciprocal-path scintillometer system was set up between the ARM Skydeck and an abandoned microwave relay tower approximately 800 m away. However, it was found that radar interference inflicted a high noise level on the data stream every few seconds, compromising the intended time averages. The data processing software was subsequently modified to provide shorter time averages to exclude the noise-impaired data (0.33 second sample rate). Software to quality control the data acquired from this revised method is now under development. Communication difficulties with hardware required a single-path scintillometer design to be utilized for a portion of the 1-year IOP.
Data from the field campaign will be used to improve the forecast model’s applications. The goals are to (1) determine what, if any, latitudinal dependencies exist, and (2) better define the two extremes-hot/dry versus cold/dry-for characterizing and forecasting the surface stability transition. Applications of this model range from defining the convective modeling starting and ending points, to improving long-range electro-optical propagation opportunities.
The ARM Climate Research Facility is a DOE Office of Science user facility. The ARM Facility is operated by nine DOE national laboratories, including .
Follow Us:


Keep up with the Atmospheric Observer
Updates on ARM news, events, and opportunities delivered to your inbox
ARM User Profile
ARM welcomes users from all institutions and nations. A free ARM user account is needed to access ARM data.


