
With a data boost from ARM during planning, a new project off the New England coast is making observations to inform predictive models of offshore wind energy resources
Offshore wind turbines can be up to 300 meters (984 feet) tall—nearly twice the height of the Washington Monument.
“As winds are higher offshore than on land, tall wind turbines are currently being installed to maximize investments,” says Raghavendra Krishnamurthy, a remote sensing expert at Pacific Northwest National Laboratory (PNNL) in Washington state.
Maximizing the efficiency of these giant structures, however, is a very tall order—one that requires improved forecasting models of offshore conditions.
Improved models require more and better observations. This is why PNNL is leading the Wind Forecast Improvement Project-3 (WFIP-3), an 18-month offshore wind observation field campaign now underway in a patch of the Atlantic Ocean near the Massachusetts islands of Nantucket and Martha’s Vineyard.
WFIP-3 is a multi-institutional effort funded by the Wind Energy Technologies Office within the U.S. Department of Energy (DOE) and NOAA. The study’s design was informed by data collected during the Two-Column Aerosol Project (TCAP), a 12-month field campaign based at Cape Cod, Massachusetts, in 2012 and 2013.
The TCAP campaign was conducted by DOE’s Atmospheric Radiation Measurement (ARM) user facility and led by PNNL’s Larry Berg. It deployed ground-based and aircraft instrumentation to study aerosols, clouds, and their interactions.
Remote sensing and radiosonde data from TCAP are being used to assess the uncertainties of predicting offshore winds, says Sheng-Lun Tai, a modeler at PNNL, referring to the area of the Atlantic off New England. “The TCAP data have been extremely helpful in understanding the complexities of various wind regimes in the region and to assess the accuracy of current-generation atmospheric models.”
TCAP Sets the Stage
The primary mission of the TCAP campaign was to measure details of atmospheric particles and their influences on cloud droplet formation. This critical stage in cloud development happens when water vapor—a gas—transitions to liquid water or ice crystals, making clouds visible.
TCAP measured two main sets of influences on cloud droplet formation: the properties of clouds themselves and the size, morphology, and chemical composition of cloud-forming aerosols.
The campaign did not set out to explicitly measure wind properties, which go unmentioned in the 2011 TCAP Science Plan. But nevertheless, TCAP’s standard meteorological sensors and instruments gave WFIP-3 planners a baseline of useful wind data. TCAP’s Doppler lidar, for instance, provided data on horizontal wind profiles, wind statistics, and vertical winds.
In addition, an ARM radar wind profiler and a sonic detection and ranging (sodar) wind profiler characterized atmospheric winds. Balloon-borne sounding systems collected data on wind speed and direction in the lower marine atmospheric boundary layer—the layer closest to the surface.
Aircraft Data Assist
As Krishnamurthy’s PNNL team worked on how TCAP data could help guide WFIP-3, they also used some of the campaign’s aircraft measurements to guide model results and make quantitative comparisons easier.
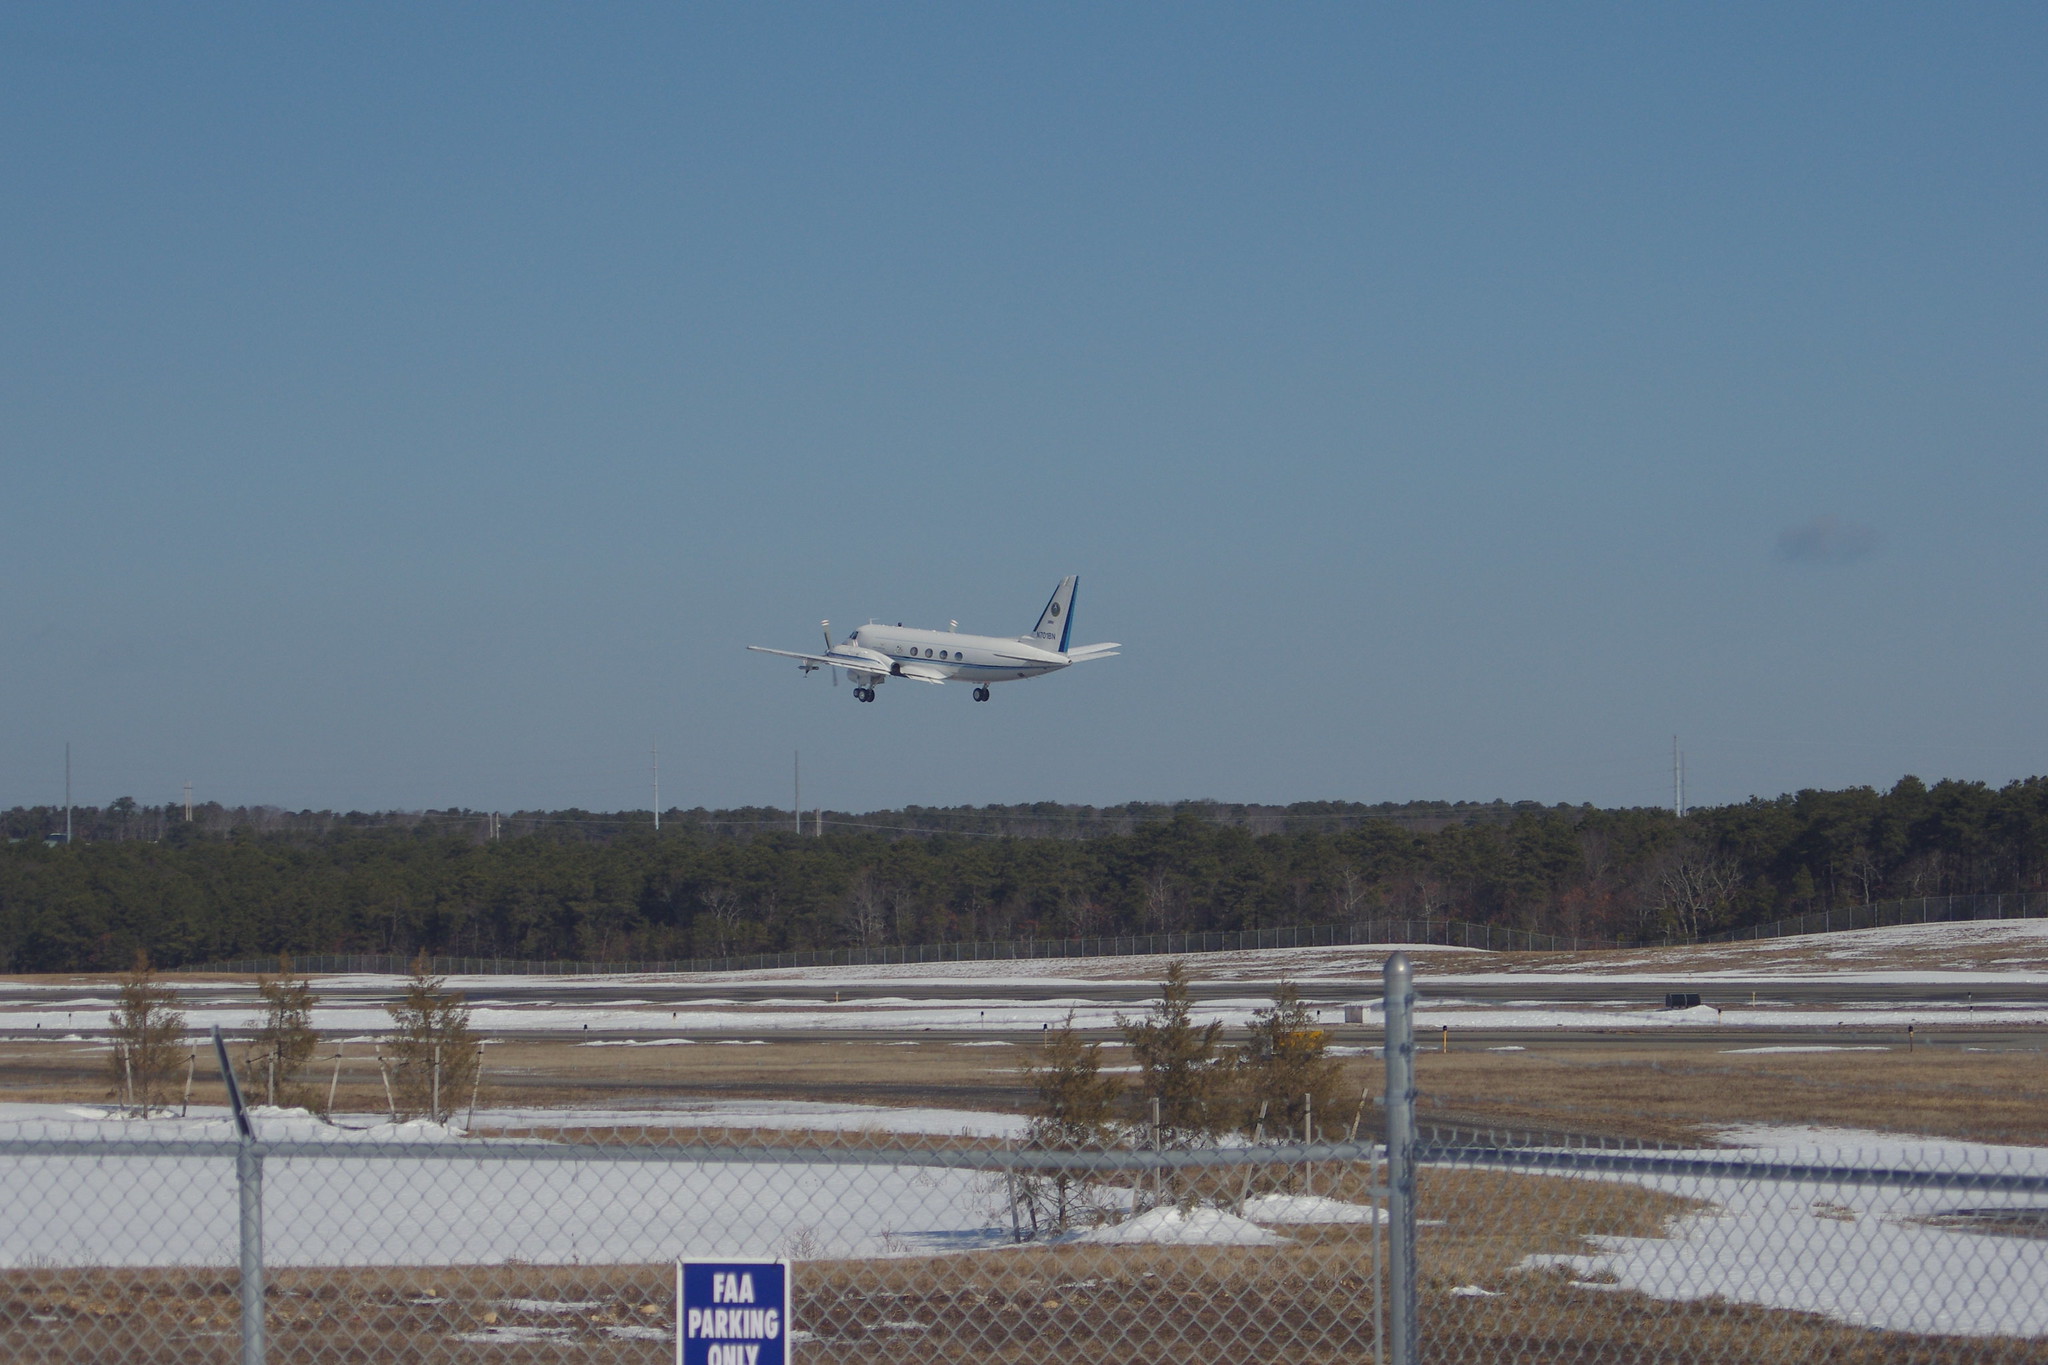
Off the coast of Cape Cod, during intensive operational periods in the summer and winter, ARM’s now-retired Gulfstream-159 (G-1) research aircraft sampled atmospheric conditions in the lower troposphere—that is, below about 4,000 meters (13,120 feet).
Some of the G-1 data captured conditions very close to the surface, from 100 to 500 meters (328 to 1,640 feet) above sea level. Measurements at such low altitudes are especially relevant to predicting offshore wind energy resources.
To make wind-related data more accessible, TCAP data inspired two ARM value-added products. One was Gridded Sonde (SONDEGRID), derived in part from measurements of horizontal winds. Another was Planetary Boundary Layer Height (PBLHT). That’s important because the depth of the marine atmospheric boundary layer is a critical dimension for improving the accuracy of marine wind forecasts.
TCAP illustrates the durable utility of older ARM data. Selected campaign measurements helped reduce some of the uncertainty in the current generation of models, says Krishnamurthy. “We were able to understand where to focus our work on developing new parameterizations.”
In modeling weather and climate, parameterizations simplify processes that are too small or too complex to be represented physically.
Krishnamurthy’s PNNL team has a paper in the works detailing TCAP’s usefulness to WFIP-3. Meanwhile, TCAP data remain freely available in the ARM Data Center.
A WFIP-3 Team
Within its science mission, WFIP-3 set out to broaden and update the kind of data TCAP provided on the way to improving numerical models of wind energy forecasts.
WFIP-3 is the third in a series of collaborative DOE/NOAA wind observation projects. The others took place in the northern and southern Great Plains and the Columbia River Gorge and Columbia Basin in eastern Washington and Oregon.
Within its science mission, WFIP-3 set out to broaden and update the kind of data TCAP provided on the way to improving numerical models of wind energy forecasts.
The campaign is being primarily conducted by PNNL, Argonne National Laboratory in Illinois, multiple NOAA laboratories, and Woods Hole Oceanographic Institution in Massachusetts. About 60 scientists are involved from these and other institutions, many of them with funding from DOE’s Wind Energy Technologies Office.
WFIP-3’s designers expect that its 18 months of offshore data will improve predictive models of weather, wind, and wave conditions influencing the near-shore, fixed-bottom turbines in the Atlantic.
Fixed-bottom technology is used in water depths of 60 meters (197 feet) or less. Offshore wind turbines that float farther out in the ocean in deeper water are not part of the WFIP-3 mission.
Virendra Ghate, part of the WFIP-3 data analysis team at Argonne, calls the offshore field study “longer in duration, better instrumented, and better sited” than others of its kind along the northeastern Atlantic coast.
“It will collect data for longer than the annual cycle of winds, meteorology, clouds, and rain in the region,” says Ghate.
‘Highly Desired’ Observations
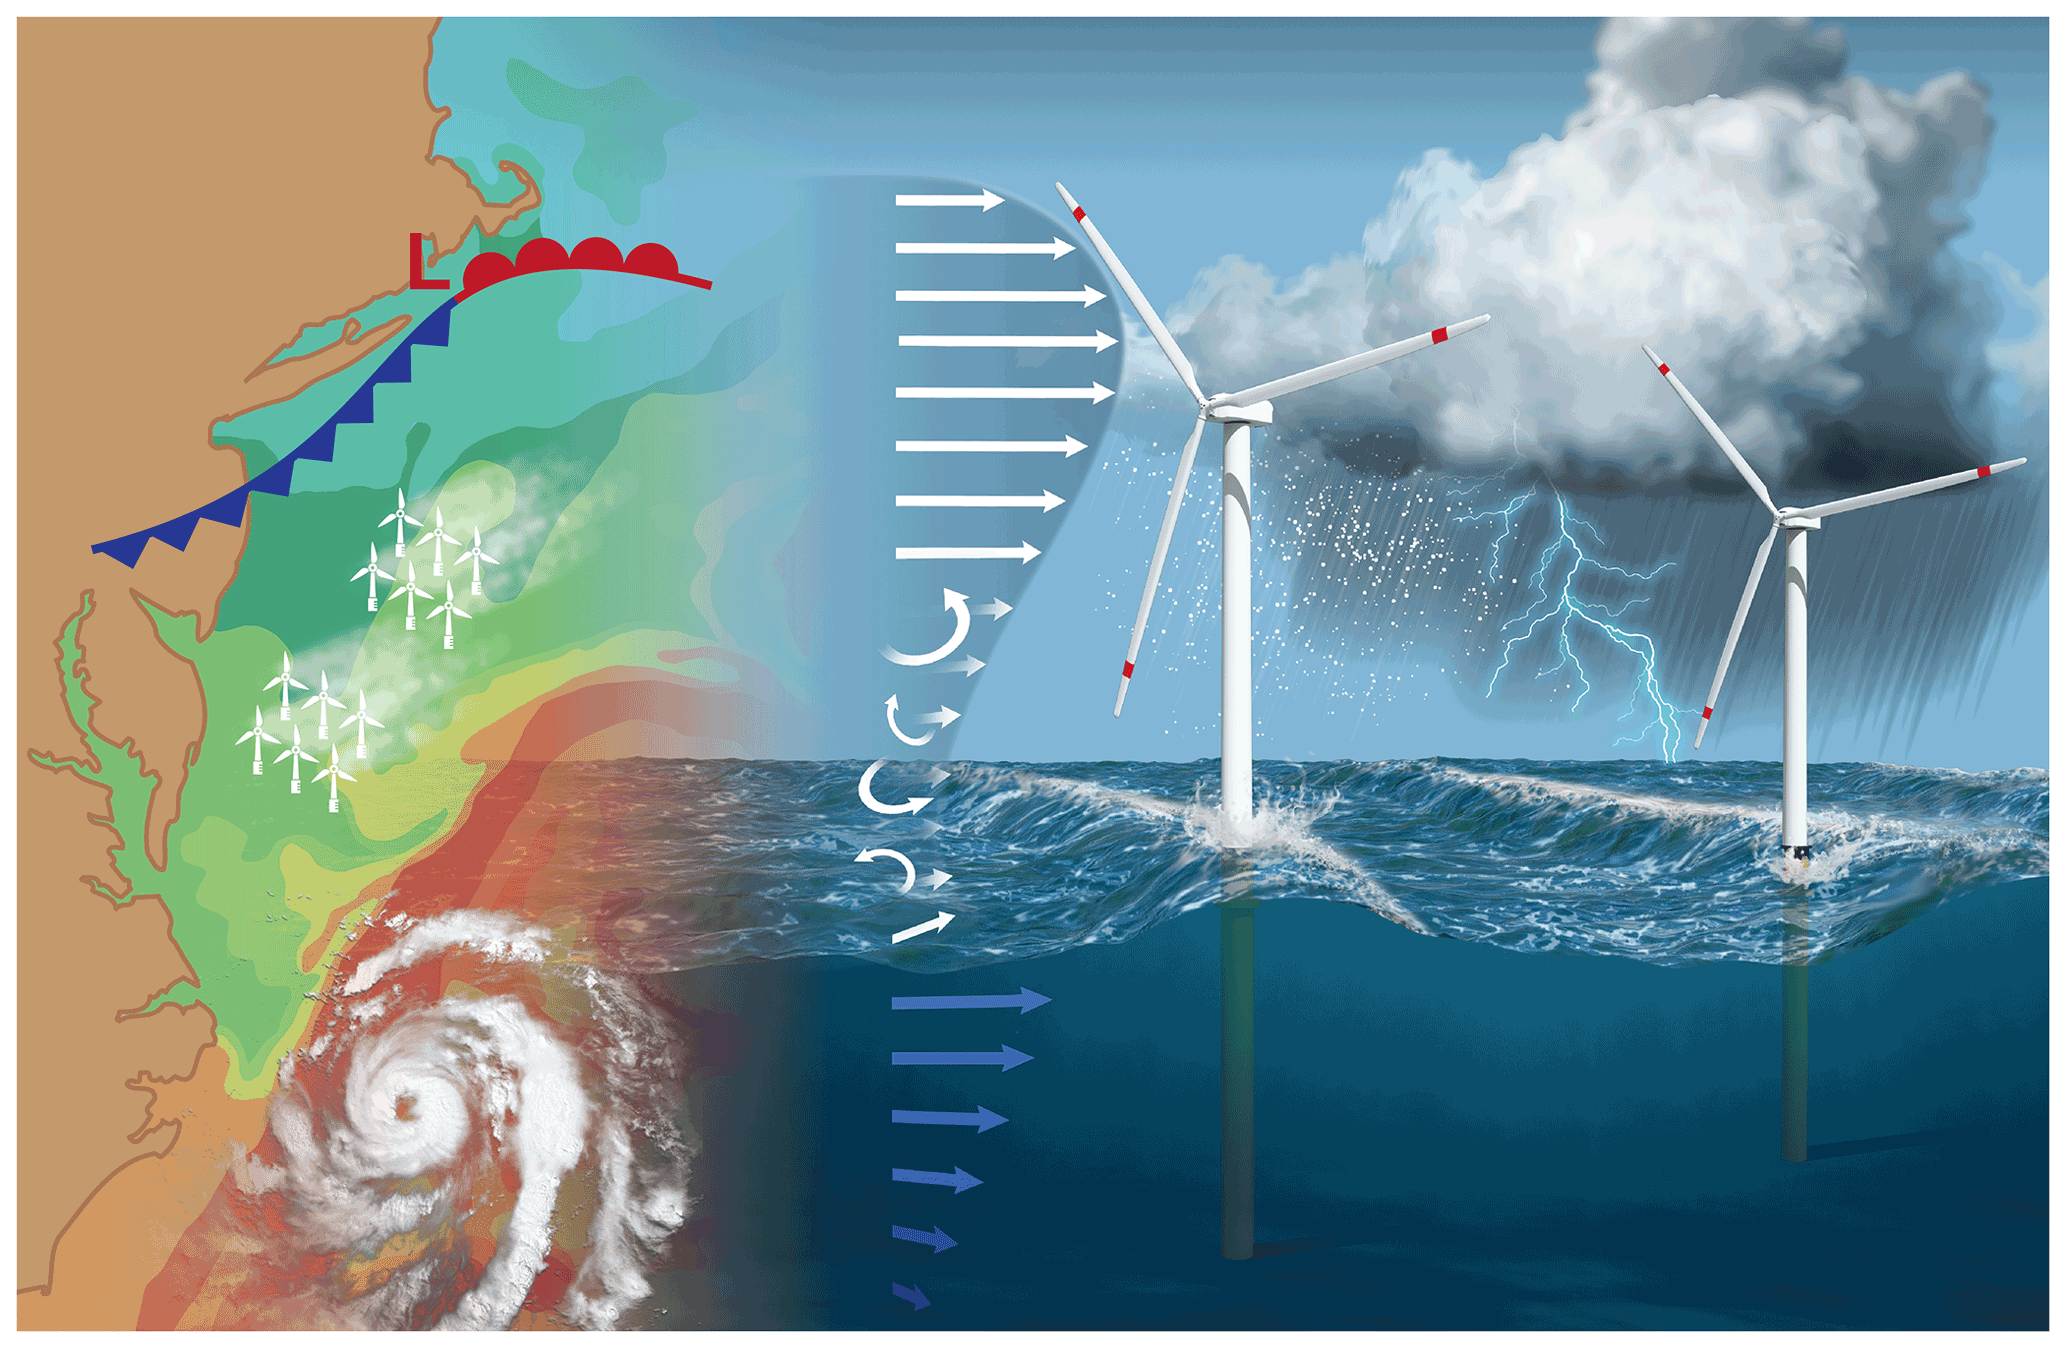
It is very demanding to create mathematical simulations of the metocean environment, which is influenced by the combined effects of meteorology and oceanography.
Modeling conditions around marine wind turbines is challenging because of the complex, fast-changing, and little-understood physics of a near-shore marine environment.
For one, wind speeds are altered by fast, unpredictable atmospheric jets that race near the ocean’s surface. Wind patterns are also influenced by rolling, heaving marine waves that vary in height and frequency.
Consider also that wind speeds driving offshore turbines change across very short time scales, from “minutes to hours,” as referenced in a 2016 paper co-authored by PNNL’s Berg.
In all, marine wind energy forecasts are clouded by uncertainties that make it difficult for wind energy companies to predict levels of available power.
But in energy terms, getting accurate forecasts of offshore wind energy resources is a high-stakes endeavor.
A 2022 Offshore Wind Resource Assessment done by DOE’s National Renewable Energy Laboratory in Colorado estimated that fixed-bottom and floating offshore wind energy platforms in eight regions of the contiguous United States have enough energy potential to supply three times the nation’s annual consumption of electricity.
Capturing that potential requires better and more observations.
“The biggest hurdle (to improving models) is that we have very few long-term data sets that can be used to investigate these processes and interactions and how to represent them in model systems,” says Dave Turner, who directs the Atmospheric Science for Renewable Energy program at NOAA’s Global Systems Laboratory. “This is why we are so excited about the field campaign. WFIP-3 observations are highly desired by our model evaluation and development teams.”
The Right Tools
Previous wind forecasting studies collected few offshore measurements. WFIP-3 will make up for that deficiency, says Paytsar Muradyan, who leads Argonne’s instrument deployment team.
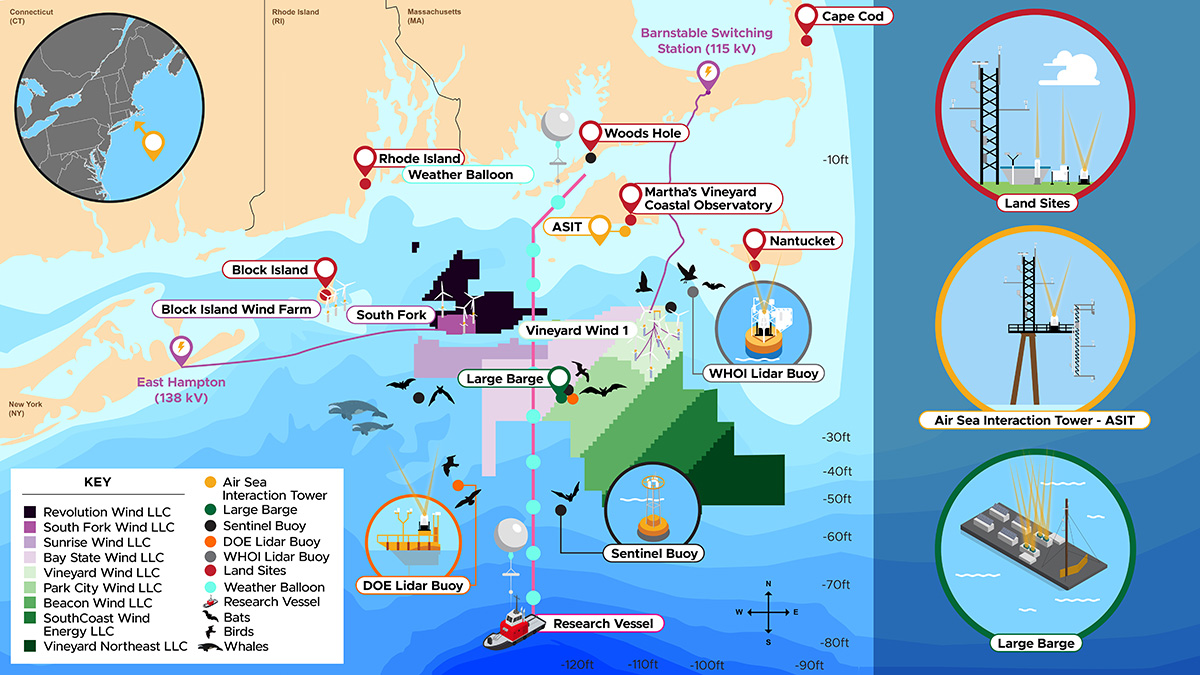
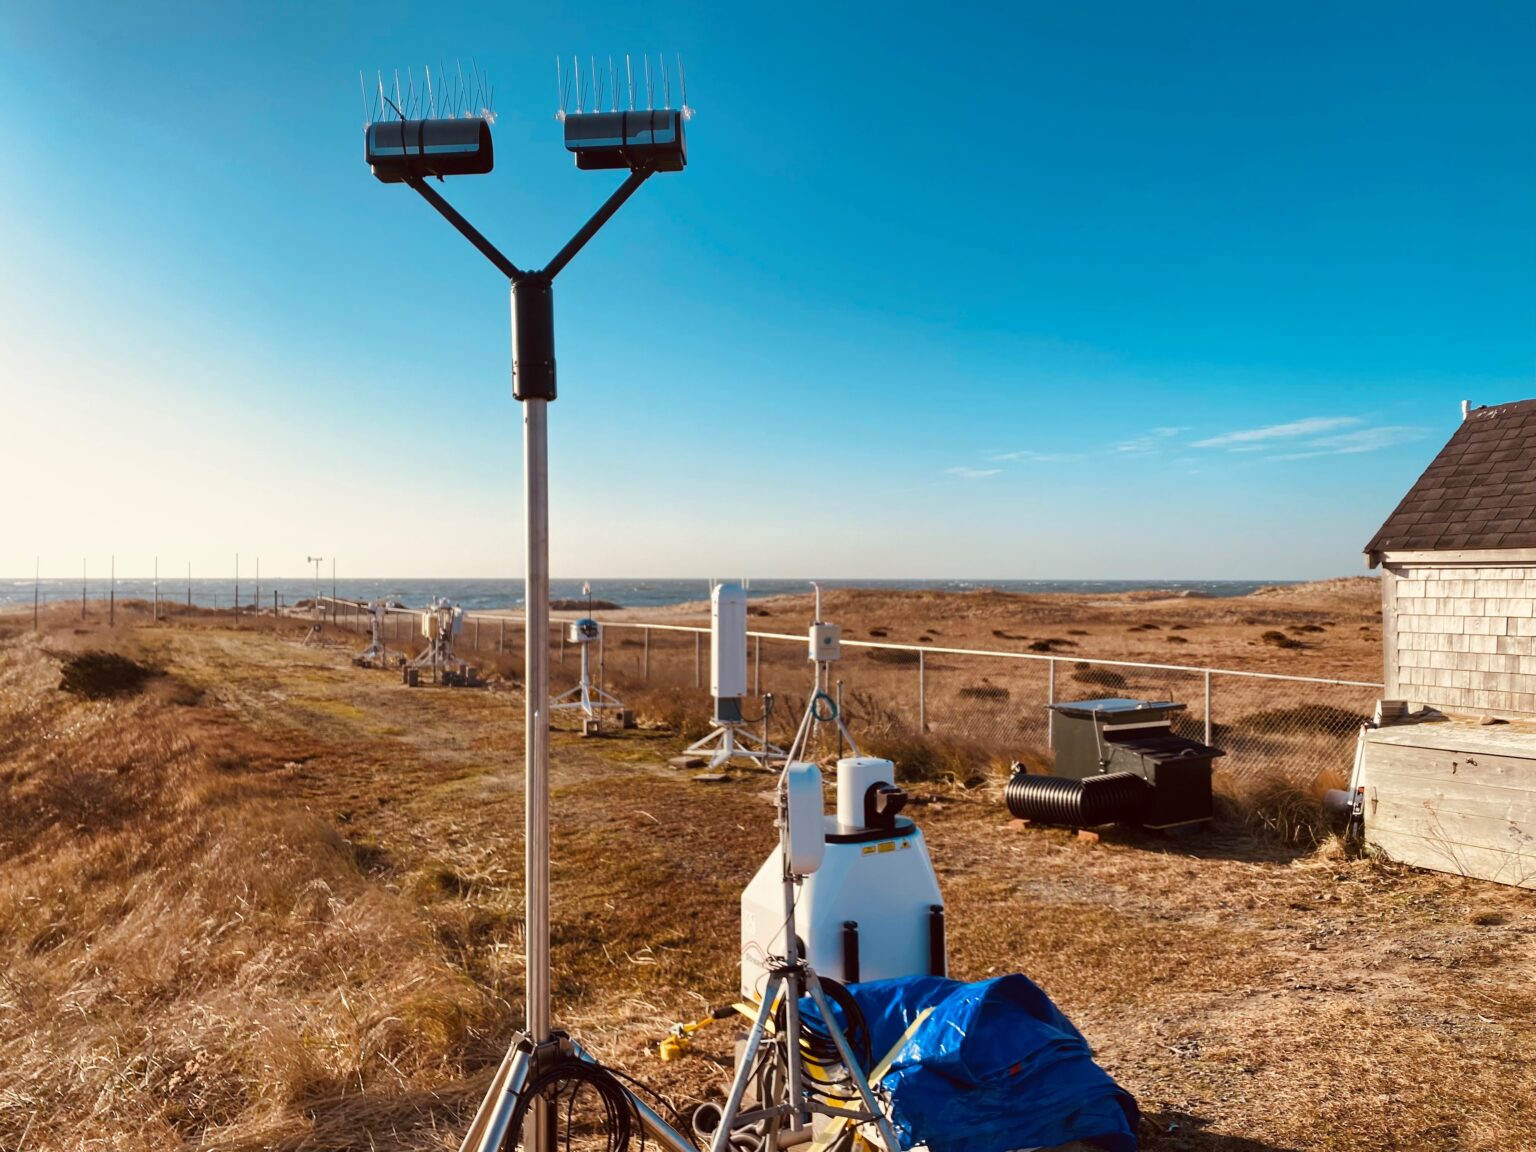
By the spring of 2024, WFIP-3’s deployed observational tools will include:
- instruments across six land-based observation sites in Massachusetts and Rhode Island
- sentinel buoys to measure meteorology and ocean surface conditions
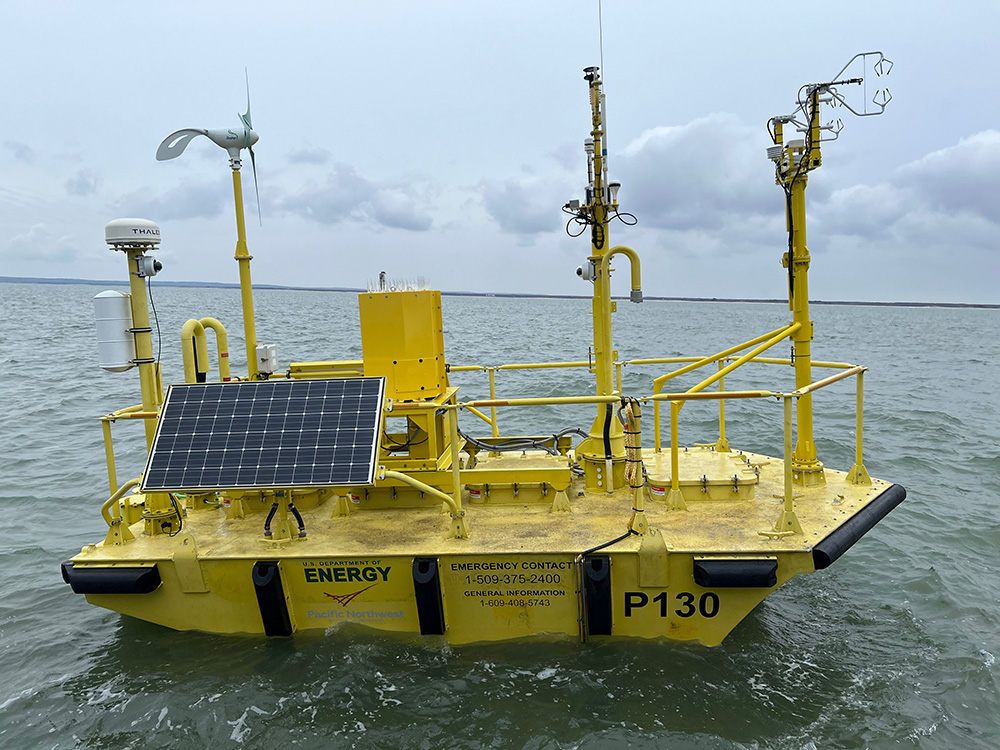
- lidar buoys, two managed by PNNL and one by Woods Hole
- a barge periodically deployed by Woods Hole, whose instruments include a W-band radar, a 20-meter (66-foot) flux tower, scanning Doppler lidars, and thermodynamic profilers
- a Woods Hole research vessel for intensive operational periods
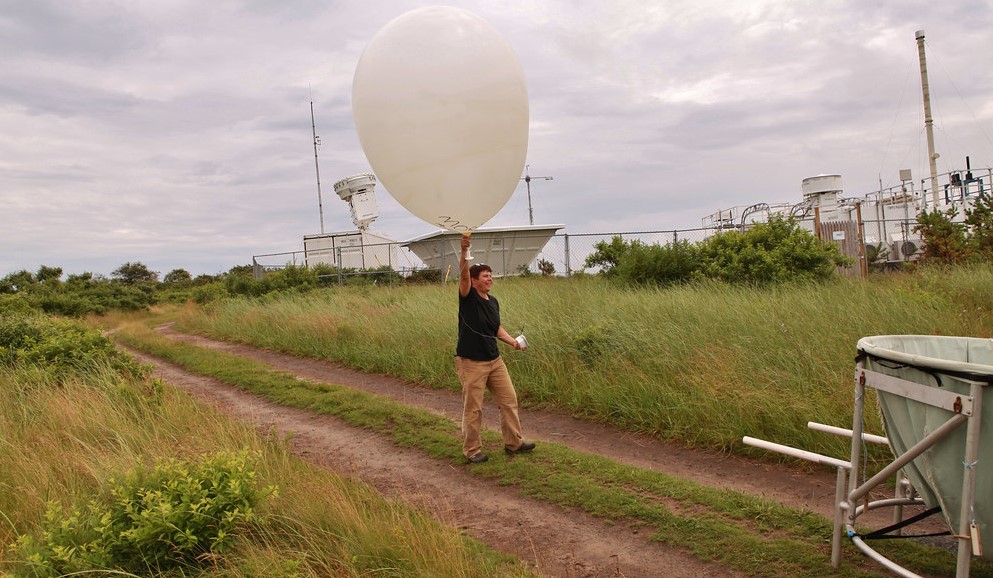
- weather balloons launched from Woods Hole during intensive operational periods.
Muradyan called Woods Hole’s Air-Sea Interaction Tower, installed south of Martha’s Vineyard in 2002, “a very unique platform” in the WFIP-3 observations toolbox.
The tower is 22 meters (72 feet) above the ocean’s surface, “completely exposed to ocean wind and wave conditions,” she says.
Combined, adds Muradyan, the tower, barge, buoys, and land-based sites will create “a unique multiscale observational array.”
WFIP-3 instruments will characterize ocean and coastal land surfaces, surface meteorology, radiation, thermodynamic properties, and the prevalence of clouds and rain.
To Ghate, the Argonne data analyst, a key component of the campaign is the barge, “where measurements will be made in a truly offshore environment.”
Even more, he adds, WFIP-3 instruments are measuring atmospheric and oceanic properties over a wide spatial area in the northeastern Atlantic.
That distribution, says Ghate, provides a measure of data redundancy and, therefore, “more confidence in our analysis.”
# # #Author: Corydon Ireland, Staff Writer, Pacific Northwest National Laboratory
ARM is a DOE Office of Science user facility operated by nine DOE national laboratories.